On July 7, spot Bitcoin ETFs saw a total net inflow of $217 million, marking three consecutive days of net inflows. Spot Ethereum ETFs recorded a total net inflow of $62.11 million yesterday, with all nine ETFs showing no outflows. https://t.co/ueXcZjuIVU
BlackRock’s IBIT led the charge with a hefty single-day net inflow of $165 million, bringing its cumulative net inflow to $52.81 billion. Fidelity’s FBTC followed suit, drawing $66.05 million in fresh capital, with its total inflows now at $12.275 billion.
However, Grayscale’s GBTC saw the largest single-day outflow of $10.2 million, continuing its net outflow trend, which now totals $23.344 billion.
On the other hand, according to SoSoValue data, the total net asset value of all Bitcoin spot ETFs stands at $135.7 billion, representing 6.32% of Bitcoin’s total market cap. The cumulative net inflow across all ETFs has reached nearly $50 billion.
💸 Bitcoin ETF's continue to see great traction of money inflowing into them. Since June 6th, there has only been one day with more money outflowing than inflowing. This said, continued incoming ETF funds bode well for $BTC's and cryptocurrency's future. https://t.co/1cNzwV4XI0pic.twitter.com/Kx7WXqdQJl
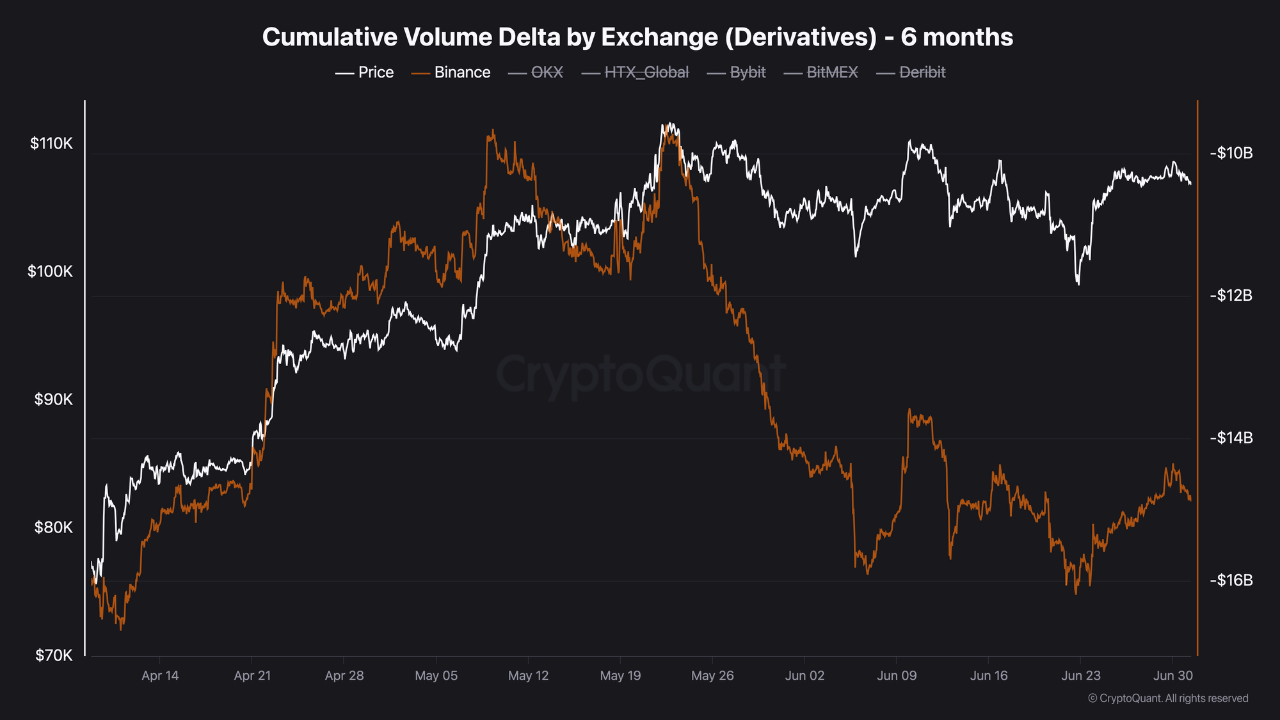
According to analyst BorisVest, Binance Derivatives traders have been aggressively selling into every bounce for the past 45 days. Cumulative Volume Delta (CVD), a key measure of net taker activity, remains decisively negative.
Cumulative Volume Delta by Exchange | Source: BorisVest
Traders continue to use market sell orders to short the range between $100,000 and $110,000, expecting a breakdown. Yet, Bitcoin refuses to budge, maintaining prices between $107K-$109K.
This stubborn price behavior in the face of relentless selling suggests that every wave of panic or profit-taking is being absorbed, likely by institutional players accumulating through ETFs and OTC desks.
Bitcoin Price Outlook: Signs of Strength
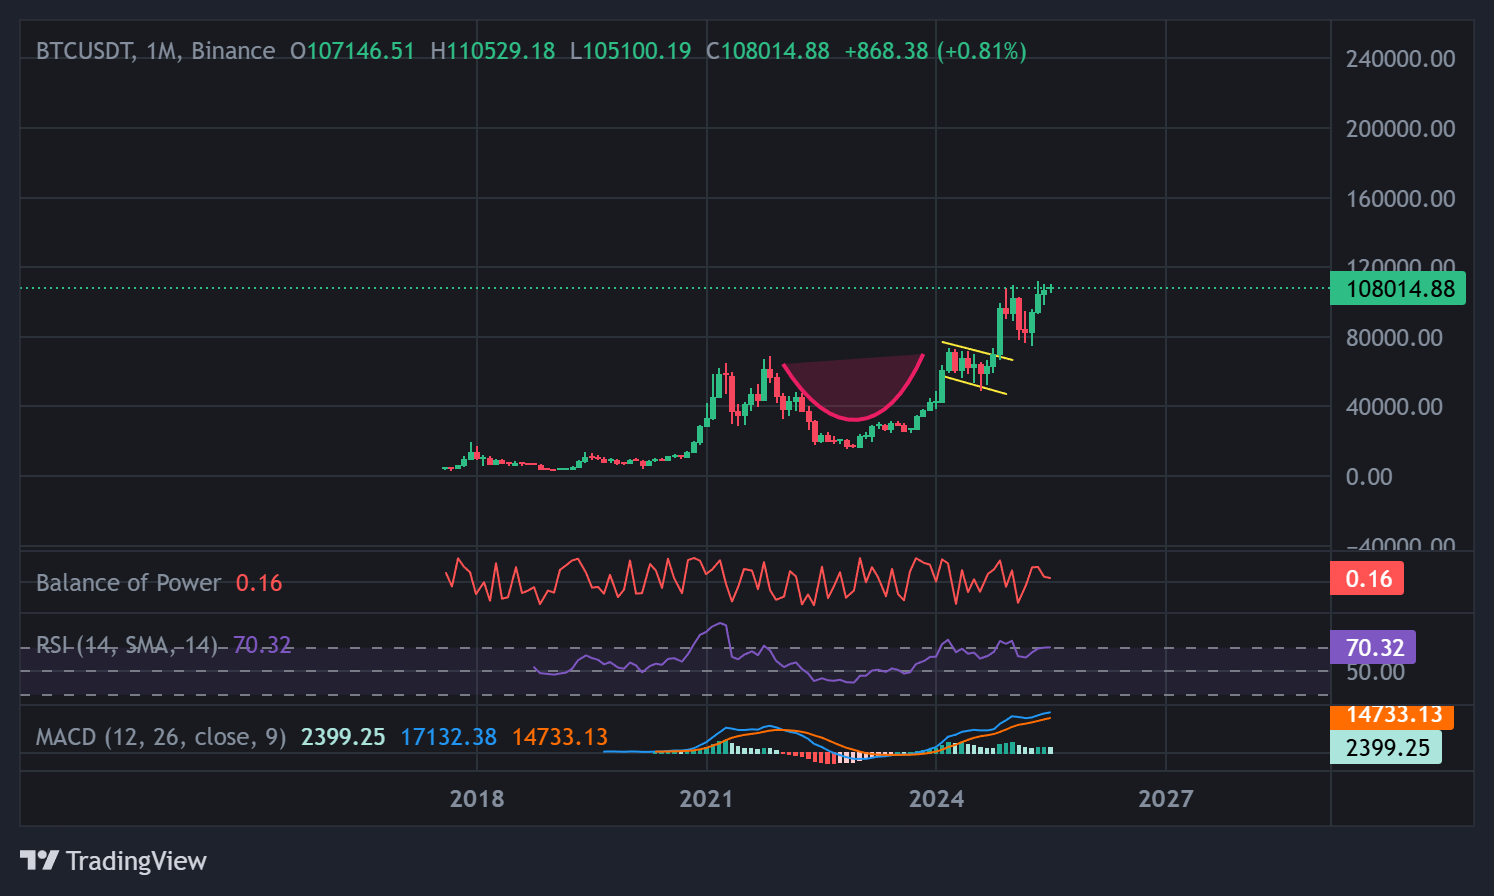
The monthly Bitcoin chart shows a textbook cup and handle pattern. The handle’s consolidation, which appeared as a bull flag, resolved to the upside, confirming continuation of the macro trend.
Based on the height of the cup ($60,000), the measured move target projects toward the $160,000–$170,000 range.
Bitcoin Monthly Chart Cup and Handle Pattern | Source: TradingView
Meanwhile, the RSI sits at 70.32, entering overbought territory, but not excessively so. The MACD histogram shows sustained positive momentum. With the MACD line above the signal line and expanding, there is no sign of trend exhaustion yet.
Additionally, the BoP reads 0.16, in positive territory, signaling bulls maintain control over price direction. If the price continues to hold and eventually breaks above the $110,000 ceiling, we could be witnessing the early stages of Bitcoin’s next major rally.
Disclaimer: Coinspeaker is committed to providing unbiased and transparent reporting. This article aims to deliver accurate and timely information but should not be taken as financial or investment advice. Since market conditions can change rapidly, we encourage you to verify information on your own and consult with a professional before making any decisions based on this content.
A crypto journalist with over 5 years of experience in the industry, Parth has worked with major media outlets in the crypto and finance world, gathering experience and expertise in the space after surviving bear and bull markets over the years. Parth is also an author of 4 self-published books.