 Fact-Checked by:
 16 mins
 Most crypto swap platforms have an identity threshold at some point in the process, such as a KYC trigger buried in the terms, a c...
Cardano Price Prediction 2026-2036
Cardano
ADA
$0.16
24h volatility:
0.4%
Market cap:
$6.06 B
Vol. 24h:
$264.11 M
trades at $0.16 as of June 21, 2026. In the last 30 days, ADA has gained ground, and over the past 24 hours, the token has climbed higher.
We look at recent price movements, volatility patterns, and broader market sentiment to estimate near-term scenarios. At a glance, Cardano’s short-term trend appears uncertain, and we break down our 24-hour outlook below. For longer-term holders, our baseline scenario puts ADA around $0.16 by the end of 2026.
Exploring potential Cardano price targets
This Cardano price prediction lays out potential price scenarios across multiple timeframes, drawing on historical data, on-chain metrics, technical signals, and macro context. We wrote this guide as a framework for your own research, not to tell you what to buy.
Cardano Live Price & Market Snapshot – June 21, 2026
| Current price | $0.16 |
| 24h change | +0.15% |
| Market cap | $7.35B |
| Circulating supply | 45.00B |
| Total supply | 45.00B |
| All-time high | $3.10 |
Cardano has demonstrated choppy price action over the past seven days, indicating that short-term momentum remains fragile as sellers step in on rallies. Zooming out to 30 days, the broader trend shows resilience, with dips getting absorbed quickly.
Beyond day-to-day price swings, Cardano is in a transition phase. The network’s shift toward real-world use cases (tokenized assets, DeFi infrastructure, government partnerships) is gaining traction after years of slow rollout. At the same time, developer activity on Cardano remains strong, with the ecosystem steadily adding functionality through hard forks.
Those fundamentals don’t erase downside risk, especially if macro conditions worsen or competing Layer 1s capture more mindshare. But this shift toward clearer use cases does make Cardano less speculative than it was in previous cycles.
Quick Forecast – Cardano Price Predictions at a Glance
Our Cardano price forecast draws on historical trends, technical indicators, on-chain activity, and macro factors to estimate potential price ranges through 2036. Below are our modeled scenarios for key years ahead:
| Year | Potential Low | Average | Potential High |
| 2026 | $0.14 | $0.16 | $0.17 |
| 2027 | $0.18 | $0.20 | $0.22 |
| 2036 | $0.29 | $0.52 | $0.90 |
Rather than setting fixed targets, we’ve opted for scenario bands that account for the crypto market’s unpredictability. The potential low represents a bearish outcome where adoption stalls, competition intensifies, or macro conditions deteriorate.
The average reflects our baseline expectation based on Cardano’s current trajectory and market conditions. The potential high captures an upside case in which multiple catalysts converge: real-world asset (RWA) rollouts, accelerating DeFi growth, and improved liquidity conditions across the crypto market.
Cardano Short-Term Price Outlook (Next 30 Days)
Over the past week, Cardano’s price pulled back to $0.16 (-5.06%). Across the last 30 days, ADA has recovered strongly from recent lows, leaving the market focused on whether that rebound can extend or fades into consolidation.
| Date | Potential Low | Average Price | Potential High |
|---|---|---|---|
| June 22, 2026 | $0.16 | $0.16 | $0.16 |
| June 23, 2026 | $0.16 | $0.16 | $0.16 |
| June 24, 2026 | $0.16 | $0.16 | $0.16 |
| June 25, 2026 | $0.16 | $0.16 | $0.16 |
| June 26, 2026 | $0.16 | $0.16 | $0.16 |
| June 27, 2026 | $0.16 | $0.16 | $0.16 |
| June 28, 2026 | $0.16 | $0.16 | $0.16 |
| June 29, 2026 | $0.16 | $0.16 | $0.16 |
| June 30, 2026 | $0.16 | $0.16 | $0.16 |
| July 1, 2026 | $0.16 | $0.16 | $0.16 |
| July 2, 2026 | $0.16 | $0.16 | $0.16 |
| July 3, 2026 | $0.16 | $0.16 | $0.16 |
| July 4, 2026 | $0.16 | $0.16 | $0.16 |
| July 5, 2026 | $0.16 | $0.16 | $0.16 |
| July 6, 2026 | $0.16 | $0.16 | $0.16 |
| July 7, 2026 | $0.16 | $0.16 | $0.16 |
| July 8, 2026 | $0.16 | $0.16 | $0.16 |
| July 9, 2026 | $0.16 | $0.16 | $0.16 |
| July 10, 2026 | $0.16 | $0.16 | $0.16 |
| July 11, 2026 | $0.16 | $0.16 | $0.16 |
| July 12, 2026 | $0.16 | $0.16 | $0.16 |
| July 13, 2026 | $0.16 | $0.16 | $0.16 |
| July 14, 2026 | $0.16 | $0.16 | $0.16 |
| July 15, 2026 | $0.16 | $0.16 | $0.16 |
| July 16, 2026 | $0.16 | $0.16 | $0.17 |
| July 17, 2026 | $0.16 | $0.16 | $0.17 |
| July 18, 2026 | $0.16 | $0.16 | $0.17 |
| July 19, 2026 | $0.16 | $0.16 | $0.17 |
| July 20, 2026 | $0.16 | $0.16 | $0.17 |
| July 21, 2026 | $0.16 | $0.16 | $0.17 |
In the short term, ETF headlines and trader positioning are driving ADA more than on-chain usage. One of the clearest catalysts in the next 30 days is the growing institutional framing around Cardano. ETF-related headlines have picked up after filings tied to ADA, and while approval timelines are uncertain, the mere presence of an ETF narrative can lead to speculative interest.
This institutional-access narrative is reinforced by the upcoming launch of Cardano futures and micro-futures on CME Group. Newly regulated derivatives often increase open interest and short-term volatility as traders hedge, leverage, or fade the initial move. In a 30-day window, this kind of event can matter more for price than fundamentals.
Governance developments are also feeding into trader sentiment. Recent large ADA delegations to community-elected DReps via GovTool and treasury allocations toward stablecoins and cross-chain tooling reinforce the idea that Cardano is becoming a mature, self-governing network.
Finally, market conditions matter. ADA has shown it can outperform during brief risk-on rotations, but its relatively high volatility cuts both ways. If momentum holds and derivatives positioning stays constructive, upside extensions are possible. But if macro sentiment weakens, price action is likely to become range-bound.
Cardano Medium-Term Forecast 2026-2027
Over the next 12 months, three factors will likely shape ADA’s path: whether Cardano can translate its scaling roadmap into actual usage, how much institutional access expands through regulated products, and whether liquidity conditions remain friendly to high-beta altcoins.
Here’s our Cardano price forecast through 2026:
| Month | Potential Low | Average Price | Potential High |
|---|---|---|---|
| July 2026 | $0.16 | $0.16 | $0.16 |
| August 2026 | $0.16 | $0.17 | $0.17 |
| September 2026 | $0.16 | $0.17 | $0.17 |
| October 2026 | $0.17 | $0.17 | $0.18 |
| November 2026 | $0.17 | $0.18 | $0.18 |
| December 2026 | $0.17 | $0.18 | $0.19 |
| January 2027 | $0.17 | $0.18 | $0.19 |
| February 2027 | $0.17 | $0.19 | $0.20 |
| March 2027 | $0.17 | $0.19 | $0.20 |
| April 2027 | $0.18 | $0.19 | $0.21 |
| May 2027 | $0.18 | $0.20 | $0.21 |
| June 2027 | $0.18 | $0.20 | $0.22 |
If the current trend holds, ADA could build on its strength and work through nearby resistance zones into mid-2026.
On the network side, the big storyline is throughput. Cardano has multiple scaling tracks in play, from Hydra (off-chain scaling for lower fees) to larger protocol upgrades aimed at increasing capacity and reducing congestion. If those improvements show up as higher transaction activity and stickier user metrics, it gives the market something more durable than “roadmap optimism”.
Ecosystem tooling is another lever. The community’s treasury commitments to stablecoin integration, oracle infrastructure, and cross-chain connections aim to close gaps that have limited DeFi growth on Cardano. Over a one-year window, the market usually reacts less to the funding announcement itself and more to what actually ships: things like live integrations and substantial growth in TVL.
Institutional access also matters in this timeframe. Regulated derivatives listings tend to deepen liquidity and make hedging easier, and ETF filings (even before approvals) can keep ADA in the conversation when capital rotates into large-cap tokens.
Cardano Long-Term Price Forecast 2026-2036
The biggest question for Cardano through 2036 is whether it can turn its research-heavy approach into a network that people and institutions actually rely on: identity systems, privacy-preserving apps, tokenized assets, and governance that doesn’t collapse the moment real money is on the line.
Here’s our 10-year ADA price forecast:
| Year | Potential Low (ROI) | Average Price (ROI) | Potential High (ROI) |
|---|---|---|---|
| 2027 | $0.18 (11.85%) | $0.20 (23.69%) | $0.22 (35.54%) |
| 2028 | $0.20 (23.70%) | $0.24 (49.92%) | $0.29 (78.66%) |
| 2029 | $0.22 (35.28%) | $0.29 (78.02%) | $0.37 (128.93%) |
| 2030 | $0.23 (46.28%) | $0.33 (107.01%) | $0.46 (184.95%) |
| 2031 | $0.25 (56.36%) | $0.38 (135.67%) | $0.56 (244.33%) |
| 2032 | $0.26 (65.22%) | $0.42 (162.58%) | $0.65 (303.68%) |
| 2033 | $0.28 (72.55%) | $0.46 (186.21%) | $0.74 (358.82%) |
| 2034 | $0.29 (78.10%) | $0.49 (205.11%) | $0.82 (405.23%) |
| 2035 | $0.29 (81.66%) | $0.51 (217.97%) | $0.87 (438.60%) |
| 2036 | $0.29 (83.08%) | $0.52 (223.83%) | $0.90 (455.42%) |
Looking ahead to 2030, ADA could benefit from compounding network adoption and a more mature governance cycle as the market decides whether Cardano is becoming “useful infrastructure” or staying primarily as a speculative asset.
On the tech side, the upside case depends in large part on Cardano shipping scalability updates that show up in the numbers: more throughput, lower friction for users, and a healthier dApp economy. Hydra adoption and protocol upgrades aimed at higher capacity matter, but only if they translate into practical outcomes (e.g., rising transaction volume).
The other long-term wildcard is privacy. A successful rollout of Midnight as a privacy-oriented partner chain could expand Cardano’s addressable market, especially for use cases where public transaction details are a non-starter.
Governance is the next pillar. Cardano has leaned hard into on-chain governance and treasury-funded development. Over a decade, these two things can either be a strength or a trap. If governance remains functional and funding is deployed responsibly, it can support ecosystem building even in down cycles. But if it devolves into gridlock, execution slows, and credibility erodes.
Then there’s the economic reality: a treasury and a roadmap are not substitutes for sustainable demand. By the early 2030s, the market is likely to care less about proposals and more about whether Cardano is generating enough activity to support development without endless dilution or “reset” narratives.
Plus, there are real risks. Competition from faster-moving networks, interoperability constraints, and the possibility that adoption remains slower than expected can cap long-term outcomes.
Overall, our model suggests an average price of $0.33 in 2030 with a potential high of $0.46 and potential low of $0.23.
Methodology for Price Predictions
Our ADA coin price prediction combines several layers of analysis to estimate potential ranges across different time horizons:
- Historical price trends: We review ADA’s past market cycles, including major drawdowns and recovery phases, and how Cardano has behaved during crypto bull and bear phases.
- Market sentiment score: We track sentiment across social platforms, news headlines, and analyst commentary, then adjust a simple sentiment bias based on the intensity and direction of news flow.
- Volatility analysis: We measure volatility across multiple windows (1d, 7d, 180d, and 3y) to understand how sharply ADA typically moves.
- Technical indicators: We use common tools such as simple moving averages (SMA) and the relative strength index (RSI) to contextualize trend strength and momentum.
- Network fundamentals: We incorporate Cardano-specific signals, including staking participation, development activity, governance milestones, and ecosystem growth metrics (e.g., DeFi usage and stablecoin activity, where relevant).
- Macroeconomic variables: We account for factors that often drive crypto flows, such as interest rate expectations and inflation trends.
Prediction Scenarios
We model forecasts in three scenario bands rather than one point estimate:
- Potential Low: Conservative downside case assuming adverse macro or weaker adoption.
- Average: Baseline scenario based on current structure and historical behavior.
- Potential High: Upside case if liquidity improves and key catalysts land as expected.
Use these projections as directional indicators, not guarantees.
What Analysts Predict
Compared with Bitcoin or Ethereum, there are relatively few institution-grade, long-term price forecasts for Cardano. Most commentary focuses on network development rather than explicit targets. That said, a handful of views are worth noting:
- Charles Hoskinson (Cardano founder): Hoskinson has repeatedly said that 2026 should be a “strong year” for both ADA and the Midnight ecosystem, though he avoids publishing formal price targets. In late 2025, he spoke to the Altcoin Daily team and compared current market conditions to “buying ADA at $0.01” in earlier cycles.
- DZ Bank (Germany): Following MiCAR approval to offer Cardano-related products in Germany, analysts tracking DZ Bank’s entry into regulated crypto services suggested ADA could reclaim the $1.00 level sometime in 2026 if it successfully breaks and holds above key resistance zones.
- Gov Capital (quantitative model): Gov Capital’s algorithmic forecast projects ADA reaching around $0.50 by September 2026. The model is based on historical price behavior, volatility, and on-chain development assumptions.
The scarcity of forecasts highlights a key reality: Cardano’s valuation outlook depends less on consensus price targets and more on whether its roadmap and governance translate into sustained real-world usage.
Bullish vs Bearish Scenarios
To understand where ADA could go over the next few years, it helps to separate the narratives that can pull prices higher from the risks that can cap upside – or trigger sharp drawdowns.
Bullish Catalysts:
- Regulated access (ETFs and derivatives): ETF filings and the rollout of regulated futures products can deepen liquidity and broaden who can get exposure to ADA.
- Scalability delivery: If Cardano’s scaling roadmap translates into measurable improvements (higher throughput, better dApp UX, lower effective fees), it strengthens the case that Cardano can support real usage at scale.
- Ecosystem upgrades: Treasury-funded work on stablecoins, oracle infrastructure, analytics, custody, and cross-chain connections can remove practical “blockers” that have held back DeFi growth.
- Governance maturity: Visible progress in on-chain governance and responsible treasury deployment can improve long-term confidence, which matters for an asset that often trades on conviction.
Bearish Risks:
- Macro and liquidity shocks: ADA tends to behave like a high-beta asset. When rates, the dollar, or risk sentiment move against crypto, ADA can drop quickly.
- Execution risk: Cardano’s roadmap is ambitious. Delays, coordination issues, or underwhelming adoption after upgrades can reset expectations.
- Composability and competition: If Cardano fails to close gaps around stablecoins and cross-chain interoperability, capital may continue flowing to ecosystems with faster iteration.
Unknown Variables
Black-swan events can overwhelm fundamentals: crypto exchange failures, smart contract exploits, sudden regulatory changes, or unexpected technical issues. These are hard to model, but they’re real risks.
Should You Invest in Cardano?
ADA can make sense for many investors looking to buy crypto, but it’s not really a “set and forget” asset. Price movements are often driven by multiple factors such as macro liquidity and broader crypto sentiment, so even solid fundamentals won’t protect you from sharp drawdowns. If you’re the type who panics on a 20-30% swing, Cardano will test you.
Time horizon matters. Cardano’s roadmap and governance evolution play out over years, not weeks, which means patience is part of the trade-off. If you may need the cash in the near term, the volatility risk is hard to justify.
Also, look at the overlap. ADA often moves with BTC and many of the best altcoins, so it may add more correlation than diversification if you’re already concentrated in crypto or tech. Do your own research and only risk what you can afford to lose.
Cardano Price Chart and Historical Performance
Cardano’s price history is basically a case study in how narratives and upgrades interact with the wider crypto cycle. ADA first traded publicly in 2017, rode the late-2017 bull run, then got crushed in the 2018 unwind alongside the rest of the market.
The 2020 COVID shock marked a major bottom for ADA (CoinGecko lists an all-time low of $0.01925 on March 13, 2020). From there, Cardano entered a more “real product” phase. The Shelley upgrade went live on July 29, 2020, bringing staking and moving the network toward community-run block production.
ADA’s biggest price moment came in 2021. Ahead of the Alonzo hard fork (September 12, 2021), which introduced smart contract functionality via Plutus, ADA hit its all-time high of around $3.09 on September 2, 2021.
From 2022 onward, ADA tracked the bear market, even as upgrades continued. Vasil (September 22, 2022) focused on performance and Plutus improvements. Cardano moved deeper into governance with the Chang hard fork on September 1, 2024, introducing the first batch of CIP-1694 governance features.
From late 2024 through January 2026, ADA largely moved with the broader market. Rallies showed up during brief risk-on phases, while pullbacks followed periods of weaker liquidity.

Cardano (ADA)
24h7d30d1yAll time
ADA trades at $0.16 as of June 21, 2026.
Cardano Technical Analysis and Key Indicators
Technical analysis won’t “predict” where ADA will go, but it does help explain whether the price is trending, chopping, or stretched. The chart below shows ADA/USDT on the daily timeframe with the 200-day simple moving average (SMA) and the 14-day relative strength index (RSI).
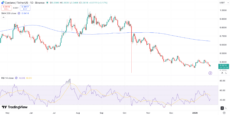
ADA’s daily price chart with 200-day SMA and 14-day RSI. Source: TradingView
200-day SMA (trend filter): The 200-day SMA sits around $0.6414, while ADA is trading near $0.3618. When the price is below the 200-day SMA, traders typically interpret that as a weaker trend over the past six months. The SMA itself is also slightly downward-sloping, suggesting the longer-term trend has been drifting lower rather than stabilizing.
14-day RSI (momentum gauge): The RSI is around 42, with the RSI average closer to the high-40s. RSI measures momentum on a 0-100 scale. Readings above 70 are commonly viewed as “overbought”, while readings below 30 are considered “oversold.” At ~42, ADA looks closer to weak-to-neutral momentum than to an extreme stretched state. That fits the recent price structure: a prolonged downtrend followed by choppy, range-like trading.
US and Global Regulatory & Tax Considerations
United States:
The IRS treats ADA as property for tax purposes. Selling, trading, or spending ADA triggers capital gains tax, with short-term gains taxed at ordinary income rates and long-term gains taxed at reduced rates. In most cases, the IRS taxes staking rewards as ordinary income when received (based on fair market value).
From a regulatory standpoint, ADA remains tradable on major U.S. exchanges, though uncertainty persists. The SEC has previously alleged that ADA could be an unregistered security in enforcement actions against exchanges. So while delegating ADA or running a stake pool is generally viewed as non-custodial, centralized staking services remain a regulatory gray area.
Other regions:
- UK: ADA is legal to trade; capital gains tax applies, and staking rewards are taxed as income.
- EU: Under MiCA, ADA is legal and regulated, with tax treatment varying by country. Some jurisdictions offer favorable long-term holding rules.
- Canada: Crypto is treated as a commodity; capital gains and staking income are taxable.
- Asia-Pacific: ADA is legal in major markets like Japan and Singapore under clear regulatory frameworks.
Forecasts represent possible scenarios based on current information, not guarantees. Cryptocurrency markets are highly volatile and unpredictable. Past performance does not indicate future results.
FAQ
What will Cardano be worth in 2026?
Can Cardano reach $10?
Is Cardano a good investment?
How accurate are crypto price predictions?
What factors affect the Cardano price?
Where can I buy Cardano?
References
- State of the Cardano Developer Ecosystem – 2025 (Cardano Foundation)
- Hydra Scalability Solution (Cardano.org)
- Midnight Network (Midnight.network)
- Cardano Fear and Greed Index (CFGI)
- Cardano Blockchain Stats (Cexplorer.io)
- Cardano Roadmap (Cardano.org)
- Cardano Price Stats (CoinGecko)
Coinspeaker in Numbers
250K+
Monthly Users
80+
Articles & Guides
5000+
Research Hours
23
Authors
guides
How to Swap Crypto on Godex: A Step-by-Step Guide to No-KYC Crypto Swapping
June 12th, 2026
CoinDepo vs. WhiteBIT Earn Comparison: Yields, Features, Security and More
June 2nd, 2026
Divine Ray (DRC) Price Prediction 2026-2030
June 1st, 2026
In the competitive world of crypto yield generation, CoinDepo and WhiteBIT Earn have built notable reputations as centralized plat...
Although most Web3 social platforms struggle to move beyond the hype phase, Divine Ray has taken a more grounded route. Its team h...
Otar Topuria
Crypto Editor, 41 postsI’m a crypto writer and analyst at Coinspeaker with over three years of experience covering fintech and the rapidly evolving cryptocurrency landscape. My work focuses on market movements, investment trends, and the narratives driving them, helping readers what is happening in the markets and why. In addition to Coinspeaker, my insights and analyses have been featured in other leading crypto and fintech publications, where I’ve built a reputation as a thoughtful and reliable voice in the industry.
My mission is to demystify the crypto markets and help readers navigate the noise, highlighting the stories and trends that truly matter. Before specializing in crypto, I worked in the IT sector, writing technical content on software development, digital innovation, and emerging technologies. That made me something of an expert in breaking down complex systems and explaining them in a clear, accessible way, skills I now find very useful when it comes to unpacking the intricate world of blockchain and digital assets.
I hold a Master’s degree in Comparative Literature, which sharpened my ability to analyze patterns, draw connections across disciplines, and communicate nuanced ideas. I’m particularly passionate about early-stage project discovery and crypto trading, areas where innovation meets opportunity. I enjoy exploring how new protocols, tokens, and DeFi projects aim to disrupt traditional systems, while also evaluating their potential risks and rewards. By combining market analysis with forward-looking research, I strive to provide readers with content that is both informative and actionable.