 Fact-Checked by:
 15 mins
 In the competitive world of crypto yield generation, CoinDepo and WhiteBIT Earn have built notable reputations as centralized plat...
XRP Price Prediction 2026-2036
XRP is trading at $1.12 as of June 10, 2026. Over the past 30 days, its price has trended higher, while over the last 24 hours, XRP has drifted lower.
Based on our model that weighs recent price action, volatility, and market conditions, XRP’s short-term outlook remains cautious, with the next 24-hour price projection outlined below. Looking further ahead, scenario-based forecasts place XRP around $1.12 in 2026.
Exploring potential XRP price targets
In this XRP price prediction, we examine the token’s potential price path across short-, medium-, and long-term timeframes by considering historical performance, technical indicators, market sentiment, and macroeconomic context. We designed our prediction to support independent research, not to recommend action.
XRP Live Price & Market Snapshot – June 10, 2026
| Current XRP price | $1.12 |
| 24h change | -0.87% |
| Market cap | $112.07B |
| Circulating supply | 99.99B |
| Total supply | 99.99B |
| All-time high | $3.84 |
XRP has shown signs of weakness over the past week, suggesting that recent price action has struggled to build follow-through amid broader volatility. Over a 30-day window, the trend remains constructive, with pullbacks finding support.
Beyond short-term price moves, XRP now exists in a different regulatory environment than previous cycles, which is a material shift in how centralized trading venues treat XRP.
Combined, recent price momentum and an improved regulatory visibility provide a clearer framework for assessing XRP’s potential. That doesn’t remove downside risk, but it does mean legal outcomes will not distort price movements to the same degree as they did in the past few years.
Quick Forecast – XRP Price Predictions at a Glance
To estimate XRP’s XRP $1.13 24h volatility: 0.7% Market cap: $69.88 B Vol. 24h: $1.83 B potential price ranges over the coming years, we modeled historical price behavior alongside technical indicators, market sentiment, macro conditions, and publicly available analyst assumptions. The table below summarizes modeled low, average, and high price scenarios:
| Year | Potential Low | Average | Potential High |
| 2026 | $1.12 | $1.12 | $1.12 |
| 2030 | $1.64 | $2.32 | $3.19 |
| 2036 | $2.05 | $3.63 | $6.23 |
These ranges are scenario bands designed to frame uncertainty. The potential low reflects a conservative case where adverse macro conditions, regulatory friction, or declining network usage persist. The average represents a baseline scenario derived from the current market structure. Lastly, the potential high illustrates an upside case that would require sustained improvements in liquidity and growth in XRP’s on-chain/payments activity.
XRP Short-Term Price Outlook (Next 30 Days)
Over the last 7 days, XRP price decreased to $1.12 (-8.44%). In the past month, it maintained upward momentum.
| Date | Potential Low | Average Price | Potential High |
|---|---|---|---|
| June 11, 2026 | $1.12 | $1.12 | $1.12 |
| June 12, 2026 | $1.12 | $1.12 | $1.12 |
| June 13, 2026 | $1.12 | $1.12 | $1.13 |
| June 14, 2026 | $1.12 | $1.12 | $1.13 |
| June 15, 2026 | $1.12 | $1.12 | $1.13 |
| June 16, 2026 | $1.12 | $1.12 | $1.13 |
| June 17, 2026 | $1.12 | $1.13 | $1.13 |
| June 18, 2026 | $1.12 | $1.13 | $1.14 |
| June 19, 2026 | $1.12 | $1.13 | $1.14 |
| June 20, 2026 | $1.12 | $1.13 | $1.14 |
| June 21, 2026 | $1.12 | $1.13 | $1.14 |
| June 22, 2026 | $1.13 | $1.13 | $1.14 |
| June 23, 2026 | $1.13 | $1.13 | $1.15 |
| June 24, 2026 | $1.13 | $1.13 | $1.15 |
| June 25, 2026 | $1.13 | $1.13 | $1.15 |
| June 26, 2026 | $1.13 | $1.13 | $1.15 |
| June 27, 2026 | $1.13 | $1.13 | $1.15 |
| June 28, 2026 | $1.13 | $1.13 | $1.15 |
| June 29, 2026 | $1.13 | $1.13 | $1.16 |
| June 30, 2026 | $1.13 | $1.13 | $1.16 |
| July 1, 2026 | $1.13 | $1.14 | $1.16 |
| July 2, 2026 | $1.13 | $1.14 | $1.16 |
| July 3, 2026 | $1.13 | $1.14 | $1.16 |
| July 4, 2026 | $1.13 | $1.14 | $1.17 |
| July 5, 2026 | $1.13 | $1.14 | $1.17 |
| July 6, 2026 | $1.13 | $1.14 | $1.17 |
| July 7, 2026 | $1.13 | $1.14 | $1.17 |
| July 8, 2026 | $1.13 | $1.14 | $1.17 |
| July 9, 2026 | $1.13 | $1.14 | $1.18 |
| July 10, 2026 | $1.13 | $1.14 | $1.18 |
XRP entered 2026 in a very different position than it was a year ago. The SEC lawsuit is over, multiple spot ETFs began trading in late 2025, and Ripple Labs has a refreshed XRPL roadmap leaning heavily into privacy features and institutional DeFi. The focus has shifted from legal drama to execution.
The biggest macro event to watch in the near term is the FOMC meeting on January 28. Rates are expected to hold, but tone matters. Dovish language would give risk assets (like XRP) room to run, while hawkish comments from Jerome Powell could keep a lid on things even if XRP-specific news is positive.
Then there’s XRP Community Day on February 11, where Ripple execs typically lay out development priorities and drop hints about what’s coming. Traders often front-run these events by betting on partnership or product announcements. With XRP finding its footing after recent weakness, a bullish catalyst here could spark a quick reversal higher.
XRP Medium-Term Forecast 2026-2027
Over the next 12 months, three main forces will likely shape XRP’s price: how quickly Ripple can execute on XRPL’s new DeFi and privacy roadmap, the direction of Fed policy across eight scheduled FOMC meetings, and whether institutional money continues to flow into spot XRP ETFs.
Here’s a look at our XRP price forecast through 2026:
| Month | Potential Low | Average Price | Potential High |
|---|---|---|---|
| July 2026 | $1.13 | $1.14 | $1.16 |
| August 2026 | $1.14 | $1.17 | $1.19 |
| September 2026 | $1.16 | $1.19 | $1.23 |
| October 2026 | $1.17 | $1.21 | $1.26 |
| November 2026 | $1.18 | $1.24 | $1.30 |
| December 2026 | $1.19 | $1.26 | $1.33 |
| January 2027 | $1.20 | $1.28 | $1.37 |
| February 2027 | $1.21 | $1.31 | $1.40 |
| March 2027 | $1.23 | $1.33 | $1.43 |
| April 2027 | $1.24 | $1.35 | $1.47 |
| May 2027 | $1.25 | $1.38 | $1.50 |
| June 2027 | $1.26 | $1.40 | $1.54 |
If current momentum continues, XRP could build on its half-year gains and push toward key resistance levels by mid-2026.
The biggest on-chain catalyst to watch is the launch of Confidential Multi-Purpose Tokens (MPTs) in Q1, the first major institutional DeFi primitive on XRPL. These tokens enable privacy-preserving collateral management, which is precisely what TradFi players require before engaging in on-chain lending at scale.
Institutional flows matter too. Spot XRP ETFs pulled in over $1B within their first month of trading in late 2025. If that pace holds, or accelerates as new funds launch, it creates sustained demand against a supply that’s already tightening on exchanges.
XRP Long-Term Price Forecast 2026-2036
Over the next decade, XRP’s trajectory hinges on whether XRPL becomes a widely used infrastructure for institutional finance. Things like tokenized bonds, compliant lending markets, and cross-border settlement at scale. Here’s our 10-year XRP price forecast:
| Year | Potential Low (ROI) | Average Price (ROI) | Potential High (ROI) |
|---|---|---|---|
| 2027 | $1.25 (11.85%) | $1.39 (23.69%) | $1.52 (35.54%) |
| 2028 | $1.39 (23.70%) | $1.68 (49.92%) | $2.00 (78.66%) |
| 2029 | $1.52 (35.28%) | $2.00 (78.02%) | $2.57 (128.93%) |
| 2030 | $1.64 (46.28%) | $2.32 (107.01%) | $3.19 (184.95%) |
| 2031 | $1.75 (56.36%) | $2.64 (135.67%) | $3.86 (244.33%) |
| 2032 | $1.85 (65.22%) | $2.94 (162.58%) | $4.52 (303.68%) |
| 2033 | $1.93 (72.55%) | $3.21 (186.21%) | $5.14 (358.82%) |
| 2034 | $2.00 (78.10%) | $3.42 (205.11%) | $5.66 (405.23%) |
| 2035 | $2.04 (81.66%) | $3.56 (217.97%) | $6.04 (438.60%) |
| 2036 | $2.05 (83.08%) | $3.63 (223.83%) | $6.23 (455.42%) |
Looking further ahead, if adoption continues at the current pace, XRP is positioned to benefit from compounding network effects and growing institutional allocation by 2030.
The biggest long-term catalyst is real-world asset (RWA) tokenization, the market that is projected to hit a multi-trillion-dollar scale by 2030. XRPL’s MPT standard brings compliance features directly into the protocol, making it attractive for institutional issuers and financial institutions in general. So if XRPL captures even a small slice of RWA flows, XRP’s valuation starts to anchor more on utility than on speculation.
The EU’s MiCA framework and proposed U.S. stablecoin laws favor “compliance-first” chains, exactly where XRPL has been building. Along with the SEC case resolved and spot ETFs live in the US, XRP has shed years of regulatory overhang.
Supply dynamics can also work in XRP’s favor. For instance, exchange balances dropped ~57% through 2025, suggesting widespread accumulation into cold wallets. Plus, in a tightening supply environment, sustained ETF inflows can move prices meaningfully.
But competition remains a risk. Ethereum and Solana continue to dominate developer mindshare. As such, XRP’s upside hinges on institutions prioritizing compliance over ecosystem size. That’s a bet that hasn’t entirely played out yet.
Ultimately, we predict an average price of $2.32 in 2030 with a potential high of $3.19 and potential low of $1.64.
Methodology for Price Predictions
We built our XRP price prediction on several layers of analysis:
- Historical price analysis: We run a multi-timeframe review covering XRP’s past bull and bear cycles, short-term volatility patterns, and long-term price trends.
- Market sentiment: We track XRP sentiment across social media platforms (e.g., X, Reddit), crypto news outlets, prediction markets, and analyst commentary.
- Technical analysis: We use core indicators, including simple moving averages (SMA), relative strength index (RSI), MACD, and trendline analysis, to identify likely short- and long-term price movements.
- Fundamental analysis: We assess XRP’s network fundamentals, including XRPL development activity, institutional adoption, and Ripple’s strategic positioning.
- Macroeconomic projections: We factor in interest rate and inflation trends, since XRP trades like a high-beta asset that’s sensitive to liquidity conditions.
Prediction Scenarios
Rather than a single price target, we use a range-based approach:
- Potential Low: A conservative estimate assuming bearish conditions – slower adoption or unexpected setbacks.
- Average: The most likely outcome based on current market structure and trends.
- Potential High: An optimistic scenario where all key catalysts (spot ETF inflows, XRPL adoption) align.
This framework accounts for uncertainty while giving you best-case and worst-case scenarios. Use these as directional indicators alongside your own research – not as guarantees.
What Analysts Predict
Several major firms and analysts have issued bullish XRP price forecasts. Here are four of the most notable.
- Standard Chartered projects XRP at $8 by 2026 and $12.50 by 2028. Geoffrey Kendrick, the bank’s Global Head of Digital Assets Research, bases this on ETF inflows of $4-8B and XRPL gaining traction as an institutional settlement infrastructure.
- Dom Kwok, a former Goldman Sachs analyst and co-founder of EasyA, has made an outlier call of $1,000 by 2030. This assumes XRP becomes a dominant cross-border settlement layer.
- Benzinga’s analyst synthesis (aggregating CoinCodex, CoinPedia, and others) places XRP in a $4.67-$26.97 range by 2030, depending on whether it captures a meaningful share of institutional banking flows.
- Bitwise Asset Management models XRP at around $12.68 by 2030 in a steady-growth scenario, with a broader range spanning from cents to the high-$20s depending on how quickly institutions adopt it.
The range varies from conservative single-digit targets to quadruple-digit moonshots, reflecting uncertainty about how much of the global payments market XRP can realistically capture in the next few years.
Bullish vs Bearish Scenarios
To understand where XRP could go from here, it helps to map out the catalysts and risks that could move the price of XRP in either direction:
Bullish Catalysts
- ETF inflows: XRP spot ETFs absorbed $1.3B in just 50 days with 43 consecutive days of positive inflows, the second-fastest crypto ETF to cross a billion dollars (after Bitcoin). If BlackRock files for an XRP ETF in 2026, it could bring another wave of institutional capital.
- Regulatory clarity: Ripple and the SEC finally resolved their lawsuit; XRP is officially a non-security on secondary markets. If Congress passes the CLARITY Act, it could put in place a federal framework for crypto custody and ETFs.
- RLUSD and banking expansion: Ripple’s stablecoin is scaling into remittance corridors, with a Japan launch planned for sometime in 2026. More ODL volume means more recurring demand for XRP as a bridge asset.
- Supply tightening: Exchange balances hit eight-year lows as tokens moved into ETF custody and long-term holder wallets.
Bearish Risks
- Stagnant on-chain activity: Despite ETF inflows, XRPL’s active addresses and dApp usage still lag behind those of Ethereum and Solana, raising questions about whether token demand is speculative rather than utility-driven.
- No native yield: XRP lacks staking, making it less competitive versus Layer 1s that offer passive returns.
- Escrow unlocks: Ripple releases 1B XRP from escrow each month. The company re-locks most of it, but the optics create sentiment drag.
- Macro sensitivity: A hawkish Fed or renewed inflation could trigger risk-off flows out of high-beta assets like XRP.
Unknown Variables
Black swan events, such as exchange collapses, major hacks, geopolitical shocks, or quantum computing breakthroughs, remain impossible to predict but could impact XRP demand.
Should You Invest in XRP?
While our XRP price prediction points to long-term upside, that doesn’t automatically make it the right investment for you. You must consider your own risk tolerance. XRP is volatile, having dropped by 50% or more from its highs multiple times, and can swing by double digits in a single week. If that scares you, XRP isn’t for you.
Also consider your investment timeline. XRP has experienced multi-year bear markets before and could do so again. If you need liquidity in the next year or two, locking up capital in a high-beta crypto involves risk.
Lastly, evaluate your current portfolio. XRP trades like a risk-on asset with a high correlation to many of the best altcoins and tech. If you’re already heavy in NASDAQ or BTC, adding XRP doesn’t diversify much – instead, it amplifies.
As always, do your own research before you buy XRP or any cryptocurrency. This price prediction is a guide, not investment advice.
XRP Price Chart and Historical Performance
XRP launched in 2012 as the native token of the XRP Ledger, built for cross-border payments that settle in 3-5 seconds. Its price history reflects the broader crypto market’s boom-bust cycles, with a few XRP-specific twists.
The token’s first major rally came in late 2017 during the ICO boom. XRP surged from under $0.01 to an all-time high of $3.40 in January 2018, briefly flipping Ethereum for the #2 spot by market capitalization. But the crash that followed dragged XRP below $0.30 by late 2018.
XRP spent most of 2019–2020 in a range between $0.20 and $0.60, until December 2020, when the SEC filed its lawsuit against Ripple. The token’s price collapsed, and major exchanges like Coinbase and Kraken suspended XRP trading, leaving it in a regulatory limbo for years.
But the turning point came in July 2023 when a US court ruled that programmatic XRP sales on exchanges were not securities. Exchanges relisted XRP, and it jumped 70%+ within days. Finally, the SEC case was fully resolved in August 2025, followed by spot ETF launches.
Xrp (XRP)
24h7d30d1yAll time
XRP set a new all-time high of $3.65 in July 2025, its first new ATH in over seven years. It’s now trading at $1.12 as of June 10, 2026.
XRP Technical Analysis and Key Indicators
Technical analysis helps traders understand price trends and momentum. It won’t predict the future, but it can offer valuable context for where an asset sits within its broader trend.
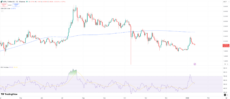
XRP’s daily price chart with 200-day SMA and 14-day RSI. Source: TradingView
The XRP price chart above shows XRP’s price with the 200-day simple moving average (SMA) and the 14-day relative strength index (RSI). The 200-day SMA plots XRP’s average price over roughly six months and often acts as a key support or resistance level.
XRP is trading below this line (around $2.05 vs. the SMA at ~$2.57), which traders generally interpret as short-term weakness. For the trend to flip bullish, XRP would need to reclaim and hold above the 200-day SMA, but that requires a meaningful catalyst.
The RSI measures momentum on a scale of 0-100. Readings above 70 suggest “overbought” conditions, and below 30 suggest “oversold”. XRP’s RSI sits around 51, which is a neutral territory, neither stretched to the upside nor signaling a bottom. This indicates the market is in a wait-and-see mode rather than at an extreme.
US and Global Regulatory & Tax Considerations
- United States: XRP is taxed as property under IRS rules. Short-term gains (held ≤1 year) are taxed at 10–37%; long-term gains (>1 year) at 0–20%. Report transactions on Form 8949 and Schedule D. XRP is available on Coinbase, Kraken, and Gemini following the SEC settlement.
- European Union: XRP falls under MiCA’s general crypto framework with no specific restrictions. Tax treatment varies by country. For example, Germany offers 0% on long-term holdings, while France applies a flat 30%.
- United Kingdom: HMRC treats XRP as property subject to capital gains tax (10–20%). Ripple UK holds an FCA Electronic Money Institution registration. XRP trades on Coinbase UK and Kraken.
- Asia-Pacific: Japan classifies XRP as a legal cryptocurrency (not a security) and is moving toward a flat 20% tax rate. Singapore does not impose a capital gains tax on individuals. Australia applies a capital gains tax with a 50% discount for holdings of more than 12 months.
Forecasts represent possible scenarios based on current information, not guarantees. Cryptocurrency markets are highly volatile and unpredictable. Past performance does not indicate future results.
FAQ
What will XRP be worth in 2026?
Can XRP reach $10?
Is XRP a good investment?
How accurate are crypto price predictions?
What factors affect XRP’s price?
Where can I buy XRP?
References
- FedWatch Tool (CME Group)
- Amendment XLS: Confidential Multi-Purpose Tokens for XRPL (GitHub)
- XRP ETFs pass $1 billion mark with no outflow days since launch (MEXC)
- Relevance of on-chain asset tokenization in ‘crypto winter’ (Boston Consulting Group)
- XRP Exchange Balance (Glassnode)
- XRP Ledger Foundation (GitHub)
- Standard Chartered predicts 330% price surge for XRP (TheStreet)
- This XRP Price Prediction From Ex-Goldman Analyst Eyes $1,000 by 2030 (FinanceMagnates)
- Ripple Price Prediction (Benzinga)
- Prediction: XRP Will Cost $10 in 2030 (Yahoo Finance)
- H.R.3633 – Digital Asset Market Clarity Act of 2025 (Congress Website)
- Ripple Partners SBI for Japan Stablecoin Distribution (FinTech Magazine)
- XRP History (XRPL)
Coinspeaker in Numbers
250K+
Monthly Users
80+
Articles & Guides
5000+
Research Hours
23
Authors
guides
CoinDepo vs. WhiteBIT Earn Comparison: Yields, Features, Security and More
June 2nd, 2026
Divine Ray (DRC) Price Prediction 2026-2030
June 1st, 2026
How to Make Your Crypto Work For You: 4 Different Methods to Explore
May 7th, 2026
Although most Web3 social platforms struggle to move beyond the hype phase, Divine Ray has taken a more grounded route. Its team h...
For most holders, crypto sits in a wallet, doing nothing. But there are smart and relatively safe methods to generate between 5–25...
Otar Topuria
Crypto Editor, 41 postsI’m a crypto writer and analyst at Coinspeaker with over three years of experience covering fintech and the rapidly evolving cryptocurrency landscape. My work focuses on market movements, investment trends, and the narratives driving them, helping readers what is happening in the markets and why. In addition to Coinspeaker, my insights and analyses have been featured in other leading crypto and fintech publications, where I’ve built a reputation as a thoughtful and reliable voice in the industry.
My mission is to demystify the crypto markets and help readers navigate the noise, highlighting the stories and trends that truly matter. Before specializing in crypto, I worked in the IT sector, writing technical content on software development, digital innovation, and emerging technologies. That made me something of an expert in breaking down complex systems and explaining them in a clear, accessible way, skills I now find very useful when it comes to unpacking the intricate world of blockchain and digital assets.
I hold a Master’s degree in Comparative Literature, which sharpened my ability to analyze patterns, draw connections across disciplines, and communicate nuanced ideas. I’m particularly passionate about early-stage project discovery and crypto trading, areas where innovation meets opportunity. I enjoy exploring how new protocols, tokens, and DeFi projects aim to disrupt traditional systems, while also evaluating their potential risks and rewards. By combining market analysis with forward-looking research, I strive to provide readers with content that is both informative and actionable.