Three Years Ago This Equation Predicted $2400 Bitcoin for 2017. In 2020, It Says Bitcoin Will be $30,000
How does an investor determine the value of a digital asset when there is often little-to-no intrinsic value that is measurable there yet? Here’s one possible method.
By Daniel Mark Harrison
Updated
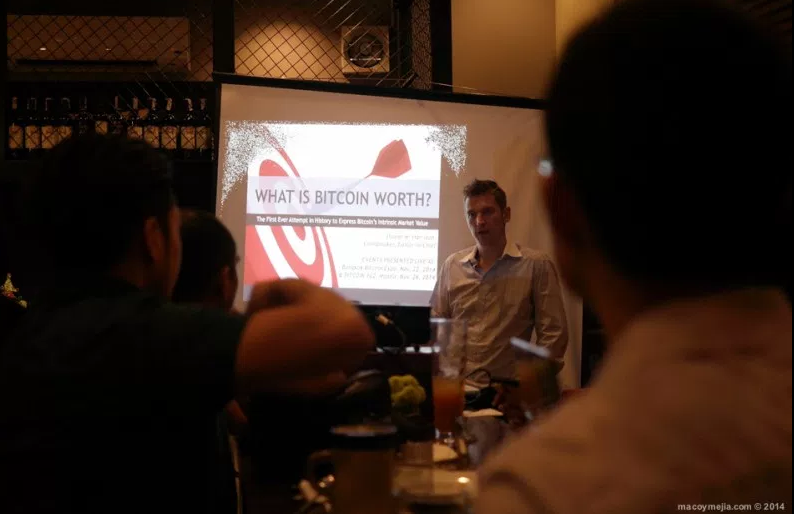
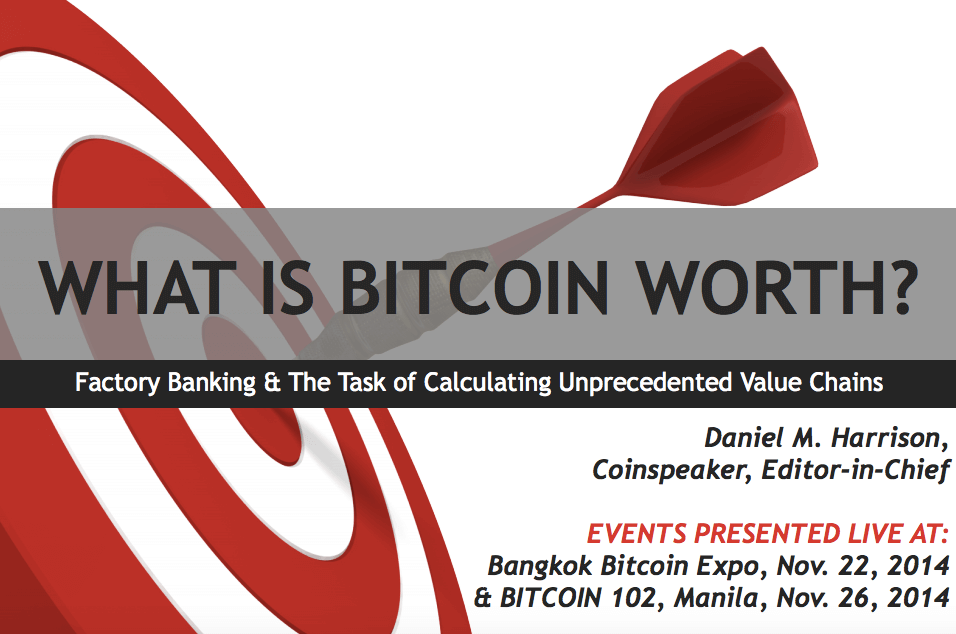
12 mins readDaniel M. Harrison giving a presentation in Manila in November 2014 where he said that Bitcoin would hit $2400 in 2017.
As volatility becomes rampant among digital currencies, a key question becomes: can you predict price behaviour in assets such as Bitcoin and Ethereum, and if so, then how?
Despite the fact that there is no official valuation model for digital assets, that doesn’t mean that there aren’t models we can apply successfully to virtual currency valuation and in turn, to price prediction.
In 2014-2015, I gave a series of presentations across Asia in which I proposed one such model – this was the first, as it turns out, to be applied to Bitcoin and similar assets.
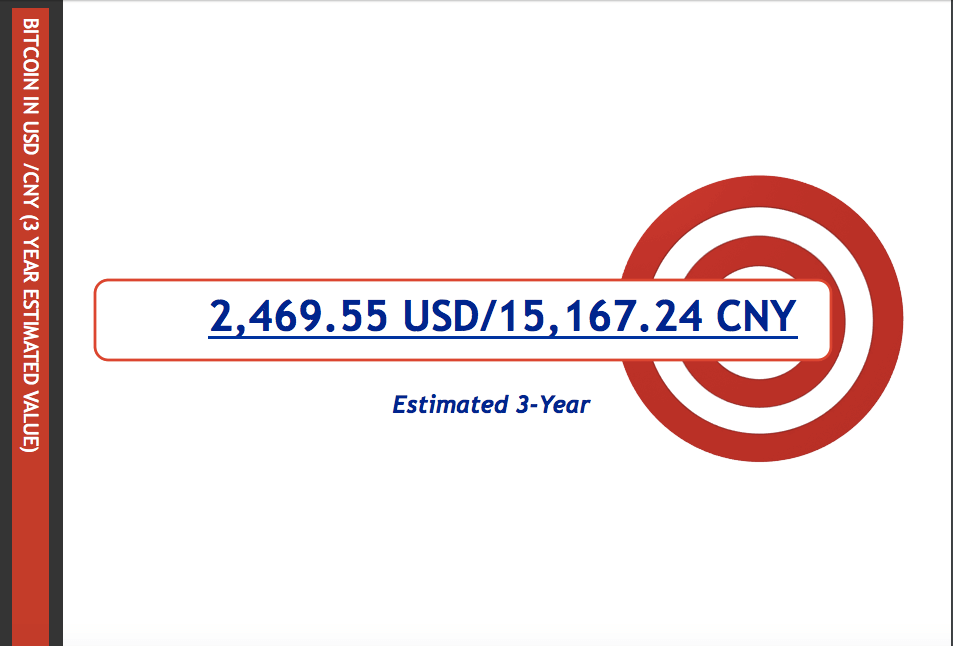
In those presentations, I showed how via establishing a formula that takes into account the core essential value configuration that is a Blockchain asset class, how Bitcoin – which was then in the $300-range – would rebound up to $2,469.55 at some point during 2017:
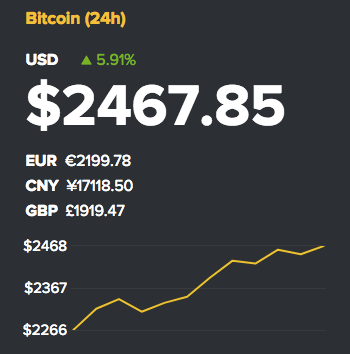
Here is the price of Bitcoin on June 1, 2017:
It goes without saying that sometimes it’s worth doing the math and thinking the concepts through before hitting buy or sell.
The Three Factors of A Meaningful Digital Asset Valuation Model
The reason that the valuation model for Bitcoin that I designed is so precise is chiefly that, rather than just focus on one variable – how much Bitcoin is spent by end-users – it takes into account 3 valuation factors.
The first factor is indeed the value of its consumption and spending power online in the virtual arena; the second is the value of its issuance price (the cost at which Bitcoin is issued relative to other digital currencies, which is essentially a discounted cashflow calculation with a constant synthetic variable thrown in to account for the hard-cap/soft-cap price inflationary dichotomy); the final, and perhaps most important factor of all, is the value of a Bitcoin once it is invested (i.e. what does it return the Bitcoin holder in terms of additional gains ex-proportionate to its own value fluctuation).
Let’s look more closely at these three factors:
Consumption (Gross Network) Value
This is the power of a virtual asset as it is spent in the way a currency is spent. This calculation involves working out the percentage value that the digital asset has and is likely to have in terms of purchasing parity across the virtual landscape. The more a currency is used, naturally, the higher the embedded value.
The problem with this figure is that it is too often the only figure that analysts consider when they work out digital asset values. The reality is that this is a big mistake, for digital assets are not only currencies; they are also assets.
Par/Issuance Value
Mainly down to the fact that some digital assets have hard caps, meaning they do not issue more than a finite number of units, and due to the fact that some of them have soft caps, meaning that they issue units ad infinitum, there must be a relative issuance value that we ascribe to these assets.
This is especially true now that there are multiple digital assets in circulation that have very different constituent characteristics. Ethereum, for example, being a virtual network of sorts whereupon IoT architecture is embedded, is completely different from, say, Litecoin, which is pure unit value.
There are a number of ways to arrive at this, and you don’t have to use mine, which you can find in the presentation PDF. No doubt my own discounted cash flow and market rate-of-return on cash (the risk free rate) calculation (which looks a bit like a cheap and nasty version of the Capital Asset Pricing Model (CAPM) to be honest) could be greatly enhanced.
But essentially it’s similar to CAPM with a little bit of valuation thrown in. Fundamentally, Par Value of a digital asset is an equation in which the following variables should all in some way be represented:
1. Alpha (relative to digital currency markets which means a certain amount of Indexing is necessary here first)
2. some kind of constant which accounts for all currencies as if they issue units infinitely (and therefore are all inflationary)
3. Beta (relative to the digital asset’s own historical price trajectory)
4. and a discounted cash flow analysis on the Net Present Value of the asset going forward at least 10 years
Invested Value
About 99.95% of the dollar’s value in the past century has been derived from its status as an investible currency. Indeed, when a currency is not invested, that is when it tends to succumb to huge amounts of price inflation (or even deflation), as consumption-concerns become the only focus of its purpose.
The invested value of a digital asset wasn’t really something recognised back in 2014 when I came up with the valuation model for Bitocoin, and it still goes pretty much unrecognised today. That’s a massive mistake, since the reason for Bitcoin’s present rise can in large part be attributed to (as I correctly pointed out at the time) the asset’s use in “crowdfunding and smart [contract] investments” today.
To illustrate how vital this final factor is to the equation, consider that Bitcoin and Ethereum invested across the board in all the available Initial Coin Offerings (ICOs) has returned investors $606 million vs. the $153 million invested in those projects (taking into account the 100% losers as well). This means that excluding any potential gains Bitcoin and/or Ethereum holders may have realised in the last 18 months on the underlying digital currencies, they are better off nearly 5x in the same period purely investing the units over the same term.
When I tried to make this point in 2014 – that digital currencies would evolve in and of themselves as investable assets with their own separate return possibilities, it wasn’t easy to grasp as people viewed the units then as speculative assets in and of themselves. No one figured they were for investing. Still to this day, most investors don’t readily think of purchasing a Bitcoin in order to invest it in a crowdfunding project or ICO (although increasing numbers do). Look at how much the scenario between 2014 and 2017 has changed in this respect, with the constant issuance of new Tokens and other digital asset innovations now abounding, and you can see clearly how centrally this aspect of digital currency valuation will end up being in determining intrinsic value of the underlying asset.
Figuring Out The Basis For Digital Asset Value
One of the challenges with digital assets is that most of them do not yet have any measurable intrinsic value. That is not the same thing as saying they have no intrinsic value: everything has intrinsic value, given time. In the case of digital assets, their intrinsic value is linked to the Internet of Things (IoT) economy, but given that the IoT economy is still nascent, intrinsic value therein is pretty much impossible to figure out for now.
Therefore, we must use the basis of what we do know to in some way measure and price this new form of value on a “best guess” basis.
By matching those three separate values together in a formula which takes into account their forecast values, it’s possible to get pretty near the value at which Bitcoin – or any digital asset, for that matter – is likely to be over a specific time range.
Here was the way I calculated the value of Bitcoin for 2017 back in 2014:
Line 1: ((Invested Value) x (Present Market Value)) = (Gross Network Value)
Line 3: (Blockchain Annual Dividend Value) x (Par Value)
Line 4: = Forecast Value in y Years [where y = (GNV/BADV)]
Line 1 covers our Gross Network (Consumption) Valuation; Line 2 deals with half the Par Value and half the Investment Value items; Line 3 involves the more arduously-attained second-half of both of these inputs (involving as it does a little extra calculation on the side to figure out the CAPM-style equation discussed above) and Line 4 represents our answer: what is a Bitcoin worth in y Years’ time in real terms today.
It’s an alarmingly simple but intuitive formula. In a nutshell, the ROI of the asset multiplied by its Market Value gives you an approximation of the Network Value today; divide this by a standard 25-year metric (or if you want to be much more precise then discount it over 25 years the exact same way you do in a standard discounted cashflow for any asset), and that’s your portion of the Network Value right there. Finally, you multiply the unit portion of the Network Value by the value of a Bitcoin relative to the values of its other universe of virtual currencies, and divide it by the number of years that’s represented when you divide the Network Value by all the various network component values.
And there you have it. This formula takes into account the gross consumption power, the returns generated from and the value at issuance as it is being issued right now of a digital asset.
One of the quick checks you can perform to see if the calculations are correct is to take the sum of the (Invested Value / Par Value) and multiply it by the Consumption Value/25 Years. The result in growth stages of the asset cycle should be about 20-30% over the Projected Value of the asset; in stages of slower growth, it falls under the PV by about this amount (in the case of my 2014 presentation for example, the result came to about $3211). Interestingly, in the past, the differential between this number and the actual forecast price for Bitcoin was around $500. The actual $500 of gains over the then-current price didn’t appear until 2 years later. When they did, that is when the currency began to materialise into bull market stage again.
How To Calculate a 2020 Price For Bitcoin
Using this pricing model, let’s figure out a price of Bitcoin today in 3 more years’ time, assuming a discounted ROI Value of Bitcoin over the last 3 years since performing such a calculation, which is now about $44.29 [(Price Increase / Years) x (25 Years)] (this means that Bitcoin’s Invested Value has doubled in the last 3 years, which is intuitively correct).
Line 2: $109,321 / 25 Years = $4,372 Blockchain Annual Dividend Value (i.e. the Blockchain is worth $4,372 per Bitcoin at the present moment in time)
Line 3: $4,372 x $9 = $39,355 Value per Bitcoin in 3 years’ time (and $109,321 / $39,355 = 2.77)
Line 4: 0.8 x $39,355 = $31,484
Note that given that we are only half way into the year, and that our previous Issuance Value was derived at the end of 2014, I shaved off the extra 3 months or so, as opposed to added them on, to the Line Item 4. (If you were going to work out 2021 numbers, you might assume 1.23 x $39,355, which is $48,406).
The BADV gives the Blockchain an estimated current intrinsic value of about $75 billion ($4,372 x 17m units of bitcoin in issue). That’s up there with some of the largest companies in the world, although still roughly about a tenth the size of Apple Inc. (NYSE:AAPL). (The reason for this is the extent of Apple’s hardware and software reach – for now, obviously).
By performing the (IV/Par V) x BADV test described above, we get $21,519, which is about 30% shy of our end result. This is the reverse of the previous experiment. What this may indicate is that $20,000 or so of the gains are likely to appear within the next 18-24 months .after which things will slow down (the reverse of the previous time since this is a bull market phase). This however could also be the true 3-year price target, intuitively, with the $31,484 being an overextended price within that time range. The evidence that this is so will be in part born out by whether Bitcoin extends its rally beyond $3000 this year; if so, then this is possibly the case (taking into account the previous anomaly of this +/-20% value).
“Didn’t You Just Cheat By Skipping On That Par Equation?”
The discerning reader will stop me here and ask, “Hold on! Not so fast! Didn’t I just see you skip past the CAPM-valuation exercise and insert $9 instead of $8 for the Par value as a cheat?”
Yes. I did. The point with the Par Value is that it doesn’t tend to move within short periods of time that much, and while it may fluctuate somewhat over shorter periods of time initially (like now) that would also be relative to the universe of digital currencies that were sprouting up similarly around it. Therefore, if our Par Value is higher than $9 (which it probably is) we would expect the total market share of the Blockchain concerned to be somewhat smaller than we are accounting for (which indeed, is the case with Bitcoin today in digital currencies vs. 3 years ago).
Essentially, because the Value of Bitcoin as we are calculating it is an expression of a multiplication between these components of the Blockchain value, it shouldn’t make that much difference here if Par varies by even quite a wide margin; the comparative extent of the influence of the Blockchain with the higher Par value will likely be much smaller (since the activity of so many other currency introductions will have been what is driving up the Par Value in the interim period).
Bitcoin Has Another 1500% of Growth To Go By 2020
Ultimately, the forecast suggests Bitcoin probably has another 1500%+ of growth ahead of it over the next 3 years; you could even say that it is still in bear market territory until the $3100-level is breached (which is another possible indicator for this number). That’s almost exactly the same amount of price appreciation that Ethereum’s network has undergone during 2017, and nearly three times the rate of price appreciation of the past three years.
Fundamentally, all of this makes a lot of sense of course: with the growth of the Token marketplace, and other ancillary financial technology infrastructure the Bitcoin blockchain harnesses and enables, this should be a time of very impressive price appreciation.
Daniel Mark Harrison is a Chairman & Chief Executive Officer of global investment company Daniel Mark Harrison & Co. (DMH&CO), a Family Office with offices and active operations in Singapore, Bangkok and Hong Kong. He is also Managing Partner of FinTech and blockchain venture capital firm Monkey Capital as well as the author of The Millennial Reincarnations, a novel published in 2015.