EOS/USD Price Analysis: Trends of September 24–30, 2018
The price has formed a “pennant” pattern on the daily chart which suggests the probability for the price to fall toward support level of $4.1.
By Azeez Mustapha
Updated
2 mins readPhoto: Shutterstock
Key Highlights
Formation of “Pennant” pattern confirmed on the daily and 4H chart;
the price might go down this week;
traders should take position patiently.
EOS/USD Long-term Trend: Bullish
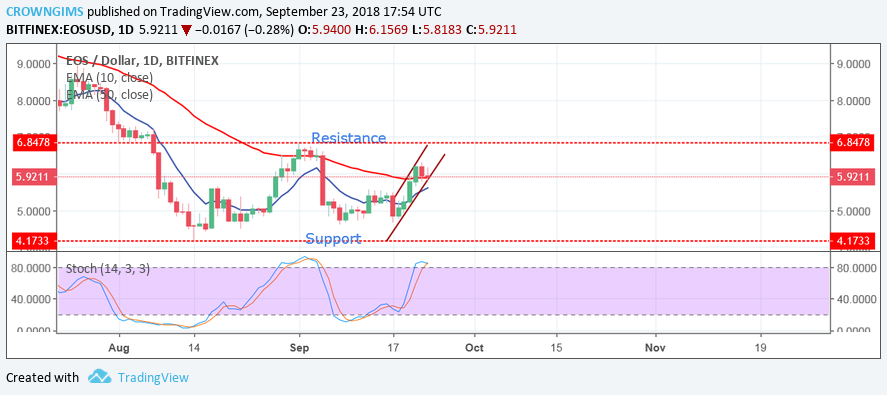
Resistance levels: $6.8, $9.4, $11.4
Support levels: $4.1, $2.0, $0.5EOS/USD is in a bullish trend in its long-term outlook. The strong bearish pressure was lost after a drop in the price towards the support level of $4.1 last week. The attempt to break lower below the support level of $4.1 was lost and the price closed higher. More buyers came in with more pressure by massive formation of bullish candles and the price was rallied to the north, pushed the price upward and broke the dynamic resistance of 50-day EMA.
As at present the price has formed a “pennant” pattern on the daily chart which suggests the probability for the price to fall toward support level of $4.1. In case the bulls increase their pressure the price will rise towards the resistance level of $6.8. The Stochastic Oscillator Period 14 on the daily chart is above the level 80 (oversold level), with its signal lines pointing downwards, which indicates the probability of a bearish movement this week.
EOS/USD Price Medium-term Trend: Bullish
The cryptocurrency on the medium term is bullish. The price moved upward with the formation of more bullish candles and crossed over 50-day EMA together with 10-day EMA, which indicates that bulls were taking control of the market. The price still ranging within the boundaries of the resistance level at $6.8 and the support level at $4.1.The coin is bullish within the channel on the medium-term outlook with the formation of more bullish candles. It has formed “Pennant” pattern which indicates that there may be decreased in price this week.
The Stochastic Oscillator Period 14 on the 4-hour chart is below 50 levels with its signal lines pointing towards the south suggesting a decrease in price which may be temporary. Traders should take position patiently.
Azeez Mustapha is a specialist in Computer Studies (including DTP), Forex and Crypto trading professional. Being expert technical and currency analyst, as well as experienced fund manager and author of several books, Azeez places strong focus on crypto market studies conducting comprehensive price analyses and sharing forecasts of presumptive market trends.

 EOS/USD is in a bullish trend in its long-term outlook. The strong bearish pressure was lost after a drop in the price towards the support level of $4.1 last week. The attempt to break lower below the support level of $4.1 was lost and the price closed higher. More buyers came in with more pressure by massive formation of bullish candles and the price was rallied to the north, pushed the price upward and broke the dynamic resistance of 50-day EMA.
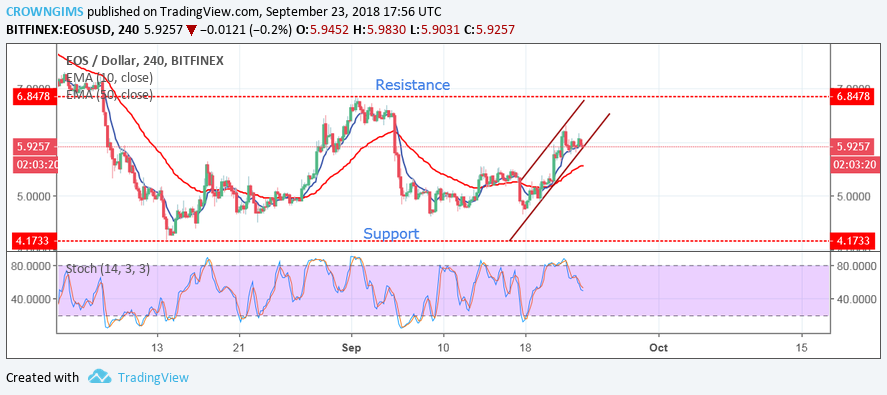 The cryptocurrency on the medium term is bullish. The price moved upward with the formation of more bullish candles and crossed over 50-day EMA together with 10-day EMA, which indicates that bulls were taking control of the market. The price still ranging within the boundaries of the resistance level at $6.8 and the support level at $4.1.The coin is bullish within the channel on the medium-term outlook with the formation of more bullish candles. It has formed “Pennant” pattern which indicates that there may be decreased in price this week.