 Fact-Checked by:
 14 mins
 Telegram has become the default platform for forex signal delivery, and the number of channels claiming to offer profitable trade ...
Render Token Price Prediction 2026-2035
Render is trading at $2.01 as of April 8, 2026. The coin is trading around recent market levels, with the price action over the past month reflecting what we’d call a mix of momentum and consolidation.
While the short-term movements have been influenced by crypto market sentiment, as per usual, RDNR has remained on the radar. This is because of its exposure to AI, GPU rendering, and decentralized compute infrastructure.
In this post, we will look at where Render’s price could land between 2026 and 2035. The focus is on past behavior, visible market trends, and wide economic factors that influence crypto cycles. Our projections aren’t made to give you investment advice, but to help frame expectations and research.
Render Live Price & Market Snapshot
Render has been moving pretty much the way the rest of the crypto market has lately. Some days it pushes up, other days it cools off, and most of the time it’s reacting to whatever the broader market is doing. That is not unusual, especially for a project tied to big narratives like infrastructure and AI.
| Current price | $2.01 |
| 24h change | +1.96% |
| Market cap | $1.07B |
| Circulating supply | 532.45M |
| Total supply | 532.45M |
| All-time high | $13.63 |
If we take a minute to zoom out, the mood around Render is still fairly positive. When the market picks up, RNDR tends to follow. When things slow down, it usually doesn’t disappear from the conversation either.
Those quieter phases often give long-term buyers time to step in before momentum returns. For many, this balance between real use and hype cycles keeps this token interesting (even when the prices aren’t flying).
Quick Forecast – Render Price Predictions at a Glance
Before we dive into long-term breakdowns, here is a high-level look at where Render could be heading over the next several years. Remember, these ranges aren’t meant to be exact targets. Instead, they reflect realistic scenarios based on adoption pace, crypto conditions, and market cycles.
| Year | Potential Low | Average | Potential High |
| 2026 | $3.50 | $5.00 | $7.80 |
| 2030 | $5.00 | $8.00 | $12.50 |
These projections are basically built around three different outcomes. The potential low assumes a more conservative scenario where the market momentum slows, the risk appetite fades, and AI-related hype cools (temporarily).
The average price is a baseline path where Render continues to grow steadily alongside broader AI and Web3 adoption.
The potential high represents the most optimistic outcome, where strong demand for decentralized GPU rendering and wider industry partnerships all line up.
Render Short-Term Price Outlook (Next 30 Days)
Over the last couple of weeks, Render has been trading without a clear direction. It’s moved up with the market on stronger days and pulled back when sentiment cooled. This is pretty typical right now. There hasn’t been a single event driving price action.
Instead, RNDR is reacting to the same things most larger altcoins are watching: Bitcoin’s moves, the overall risk appetite, and the trend surrounding AI-related tokens at the moment.
| Period | Potential Low | Average Price | Potential High |
| Next 30 days | $2.20 | $3.10 | $4.40 |
In the next 30 days, a few real-world events could influence Render’s price action. One thing on the horizon is the ongoing roadmap progress, especially updates tied to network improvements and governance proposals. For example, the Render Network is currently moving forward with proposals aimed at expanding compute capacity and boosting the rewards for high-end GPU operators. This could potentially attract more professional users over time.
Community votes around these proposals can also create short-term volatility since the traders react to outcomes and speculation builds before the decisions are finalized.
There are also some big changes happening under the hood. The project’s governance system is active, with proposals like RNP-021 focused on adding enterprise-grade GPU support and adjusting tokenomics flow. If these pass, sentiment could get a near-term boost.
Render Medium-Term Forecast 2026-2027
If we look beyond the short-term noise we described above, Render’s price over 2026 and 2027 is likely to be influenced by a mix of AI-sector demand and broad crypto market cycles. This is the part where fundamentals start to matter much more than the headlines.
12-Month Render Price Forecast
| Month | Potential Low | Average Price | Potential High |
| 1 | $2.50 | $2.80 | $3.10 |
| 2 | $2.60 | $3.00 | $3.30 |
| 3 | $2.70 | $3.20 | $3.50 |
| 4 | $2.80 | $3.40 | $3.80 |
| 5 | $2.90 | $3.50 | $3.90 |
| 6 | $3.00 | $3.70 | $4.10 |
| 7 | $3.10 | $3.90 | $4.30 |
| 8 | $3.20 | $4.10 | $4.60 |
| 9 | $3.30 | $4.30 | $4.80 |
| 10 | $3.40 | $4.50 | $5.10 |
| 11 | $3.50 | $4.70 | $5.30 |
| 12 | $3.60 | $4.90 | $5.60 |
ROI, or return on investment, simply refers to the percentage change between the starting price and a later price. We use it here to paint possible outcomes under different scenarios. This is not a recommendation or a guarantee of any kind.
If the current momentum continues, Render could possibly build on its half-year progress and start testing higher resistance levels by mid-2026. But if conditions turn less favorable, the price action may remain more compressed until clearer macro catalysts emerge.
On the adoption side, Render continues to benefit from real use in 3D rendering, digital art, and AI-related workloads. This gives it something many tokens don’t have – the ongoing demand outside of trading.
Render Long-Term Price Forecast 2026-2035
If you take a minute and zoom out, Render’s long-term price story is less about short-term volatility and more about whether decentralized GPU rendering keeps finding real demand on the market. The reality is this – AI-generated content, 3D graphics, and immersive media are here to stay. Now, if Render continues to sit in the middle of this trend, the long-term price growth becomes much easier to justify.
| Year | Potential Low (ROI) | Average Price (ROI) | Potential High (ROI) |
| 2026 | $3.50 (+46%) | $5.00 (+108%) | $7.80 (+225%) |
| 2027 | $3.80 (+58%) | $5.50 (+129%) | $8.50 (+254%) |
| 2028 | $4.20 (+75%) | $6.20 (+158%) | $9.50 (+296%) |
| 2029 | $4.60 (+92%) | $7.00 (+192%) | $11.00 (+358%) |
| 2030 | $5.00 (+108%) | $8.00 (+233%) | $12.50 (+421%) |
| 2031 | $5.50 (+129%) | $9.00 (+275%) | $14.50 (+504%) |
| 2032 | $6.00 (+150%) | $10.50 (+338%) | $16.50 (+588%) |
| 2033 | $6.50 (+171%) | $12.00 (+400%) | $19.00 (+692%) |
| 2034 | $7.20 (+200%) | $13.50 (+463%) | $21.50 (+796%) |
| 2035 | $8.00 (+233%) | $15.50 (+546%) | $24.00 (+900%) |
Looking ahead, if adoption continues at its current pace, Render can benefit from wider exposure to institutional capital by 2030. The token already sits in a very specific corner of the market: decentralized GPU rendering. This is a service tied directly to rising AI and visual computing demand.
Render’s value comes from real use. Artists, studios, and developers rely on the network. This matters because, over time, money tends to go to projects people actually use.
The token also has a capped supply. This helps support long-term prices if the demand keeps rising.
Regulation is improving, too. Rules like the EU’s MiCA make it easier for larger investors and funds to participate. That reduces the uncertainty compared to past cycles.
While mainstream adoption won’t likely happen overnight, the trend here is clear. GPU demand is growing. AI workloads are increasing. Centralized computing is expensive. Render sits in the middle of all three. If these trends continue, RND’s long-term growth looks realistic.
Methodology for Price Predictions
Our price predictions are built using a combination of historical data, market behavior, as well as forward-looking assumptions. We try and stay away from single fixed models since the goal isn’t to guess exact prices, but to outline realistic ranges based on how similar assets have moved in the past.
We start by analyzing historical price trends across multiple timeframes. This means using short-term moves, but also full market cycles to make a prediction. This helps us find the recurring patterns and the support and resistance zones. It also tells us how RNDR has behaved during both the bull and bear phases.
Market sentiment is assessed next and can be adjusted manually based on news flow and shifts in investor interest. We pair this one with volatility analysis measured across 1-day, 7-day, 180-day, and multi-year periods. The goal is to account for both sudden price swings and long-term stability.
On the technical side, we use commonly followed indicators such as:
- Simple Moving Averages (SMA)
- Relative Strength Index (RSI)
The idea is to gauge trend direction and momentum.
Long-term projections also consider network fundamentals, which include adoption trends and the project’s role within its sector.
Finally, we look at broader macroeconomic variables. These include interest rates, inflation, and overall risk appetite. The idea is to find how external conditions influence crypto markets.
What Analysts Predict
For major cryptocurrencies, expert forecasts from reputable firms can give you a sense of where the market sees potential over the coming years. Let’s see what analysts predict for major coins on the market.
Bitcoin (BTC)
ARK Invest projects Bitcoin could reach up to $2.4 million by 2030 in its most bullish scenario. Their scenario comes with lower base cases around $710,000 and $300,000, depending on market conditions.
Standard Chartered initially forecast Bitcoin around $200,000 by the end of 2025, though they later revised this down to about $100,000 for 2025 and $150,000 for 2026. Their long-term goal is to reach $500,000 by 2030.
Ethereum (ETH)
Standard Chartered raised its year-end 2026 price target for Ether to $7,500, citing increased institutional interest and expected expansion in on-chain fees. The bank also extended its 2028 forecast to about $25,000 under optimistic adoption scenarios.
Citigroup (Citi) forecasts a year-end 2026 target of nearly $4,300 for Ethereum, expecting ETF flows to be smaller than those for Bitcoin.
XRP
There are limited formal forecasts from major research firms for XRP. JPMorgan analysts have noted that a spot XRP ETF could attract $3-$8 billion in inflows if approved. Also, community sentiment on platforms like Reddit and X shows great optimism around regulatory clarity and ETF possibilities.
Render
Unlike these major cryptocurrencies, Render doesn’t have much coverage from big financial firms like Bitwise or Ark.
CoinPriceForecast thinks that Render’s price could gradually increase through the late 2020s, reaching around $3.70 by the end of 2026 and rising to about $8.16 by 2035 in their baseline scenario.
Bullish vs Bearish Scenarios
Bullish Catalysts
- Big investors and institutions are putting money in, including crypto ETFs.
- Clearer, supportive regulations that make it easier for funds to invest.
- More people and businesses are starting to use RNDR for rendering and AI tasks.
- Partnerships with major companies that boost the network’s visibility.
- Network upgrades that make Render faster and more efficient.
Bearish Risks
- Strict regulations or outright bans in important markets.
- Economic problems, like rising interest rates or a recession.
- New competitors offering similar services.
- Hacks, bugs, or other technical failures.
- Developers or the community are losing interest.
Unknown Variables
- Sudden shocks, like exchange collapses or major hacks.
- Political conflicts or global crises affecting markets.
- Unexpected tech breakthroughs or risks, like quantum computing.
Should You Invest in Render?
Render (RNDR) could be interesting for investors who are comfortable with higher-risk, high-reward assets. It is best suited for people with a longer time horizon who can ride out crypto volatility and believe in the growth of decentralized GPU rendering and AI workloads.
Before you jump in, consider a few things: the price can swing a lot in the short term, adoption may take time, and regulatory factors could affect the market a lot. Smaller niche projects like RNDR can experience sudden hype cycles and corrections, much more sharply than major coins.
Diversification is key here. RNDR shouldn’t be your only crypto holding. Pair it with larger, more established assets that can help manage risks while still allowing you exposure to the potential upside.
Finally, do your homework. Follow network updates, check partnerships, check community sentiment, and monitor developer activity. Knowledge is your best tool in crypto investing.
Render’s Historical Performance
- Launch and early years (2020): RNDR first appeared on exchanges in mid-2020, trading around $0.08-$0.13 shortly after launch.
- Initial bull run (2021): During the 2021 crypto boom, RNDR rallied sharply. It passed $2 in March 2021 and later made a new high near $8.80, riding the broader altcoin surge.
- Crypto winter downturn (2022): Like most projects, RNDR fell hard in the 2022 bear market. By mid-2022, its price dipped to around $0.40.
- Recovery (2023): The renewed interest came in 2023 as DePIN and decentralized compute concepts gained more traction. RNDR climbed back toward the $4-5 range.
- All-time high (March, 2024): In one of its strongest rallies yet, RNDR reached its all-time high near $13.53.
- Post-ATH correction (Late 2024-2025): After the peak, price retracted, fluctuating in the $2-6 range.
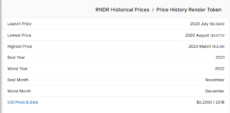
RNDR historical prices. Source: CoinLore
Render Technical Analysis and Key Indicators
If we look at Render’s recent market action, the coin shows a strong rebound after a period of decline. From late December 2025, RNDR’s market cap climbed sharply and surpassed $1.2 billion, which signals renewed buying interest. The daily price movements show some volatility.
Volume patterns support the upward move. Noticeably higher green bars during rallies tell us that buying pressure is pushing the prices higher. In general, the strong volume on up days suggests confidence in the rally.

Render (RNDR)
24h7d30d1yAll time
Two common indicators to understand trends are the 200-day Simple Moving Average (SMA) and the 14-day Relative Strength Index (RSI):
- 200-Day SMA is the average price over the last 200 days. When the price is above the SMA, it usually shows a strong long-term trend. If it drops below, the trend may be weaker or in a correction.
- 14-Day RSI measures short-term momentum. An RSI near 70 indicates the coin may be overbought and could pause or pull back slightly. An RSI near 30 shows oversold conditions and possible pressure upward.
Overall, this chart tells us that Render is in a recovering phase and has a positive momentum, but the market remains volatile.
US and Global Regulatory & Tax Considerations
Cryptocurrency rules differ widely depending on your location. Here’s a helpful summary in brief for Render (RNDR) investors:
United States
- Taxation: Capital gains tax applies to crypto profits. Gains must be reported on your annual tax return, whether short-term (held less than a year) or long-term.
- KYC/AML: US exchanges require full identity verification. This includes ID and sometimes proof of address.
- Exchange access: Most US-based investors use platforms like Coinbase, Kraken, or Gemini.
- Regulatory status: RNDR is generally treated as a property/asset for tax purposes, not a security.
European Union and the UK
- Taxation: Rules vary by country. In the EU, crypto gains are usually taxable, but some countries offer exemptions for small amounts. The UK treats crypto as capital gains.
- KYC/AML: Exchanges in the EU/UK follow strict EU regulations and require ID verification.
- Exchange access: Major European exchanges include Bitstamp, Binance EU, and Kraken.
Asia-Pacific
- Taxation: Varies widely. Japan and Australia tax crypto gains. Singapore generally doesn’t tax long-term gains.
- KYC/AML: Most regulated exchanges require verification.
- Exchange access: Binance, KuCoin, and local exchanges serve these regions, but access rules differ by country.
FAQ
What will Render be worth in 2026?
Can Render reach $10,000?
Is Render a good investment?
How accurate are Render price predictions?
What factors affect Render’s price?
Where can I buy Render?
References
- What Is Render (RNDR) and How Does It Work – NDAX.io
- Cryptocurrency Risk Appetite – Financial Crime Academy
- Render Network Foundation Monthly Report – Rendernetwork Blog
- Latest Render News Update – CoinMarketCap
- ARK’s Target for Bitcoin in 2030 – ARK Invest
- Standard Chartered Lifts Year-End Ether Forecast – Reuters
- Citi Forecasts Ether’s Year-End Target – Reuters
- JPMorgan Predicts $8 Billion Can Flow into XRP ETF – Reddit
- News Sentiment 24 Hours – AltFins
Coinspeaker in Numbers
250K+
Monthly Users
80+
Articles & Guides
5000+
Research Hours
23
Authors
guides
Best Forex Signals Telegram Groups & Channels in 2026
April 1st, 2026
Best Crypto Whitelabel Solutions in 2026
March 31st, 2026
5 Best Crypto Exchange APIs to Use in Your Business 2026
March 24th, 2026
Building a crypto exchange from scratch used to take months of development, six-figure infrastructure budgets, and a dedicated com...
Developers and businesses looking to integrate trading, swapping, or fiat on-ramps into their applications rely on crypto exchange...
Nadica Metuleva
, 47 postsI’m a seasoned writer with over a decade of professional experience, specializing in crypto, technology, business, and iGaming. Over the years, I’ve built a reputation as a trusted contributor to well-known outlets such as InsideBitcoins, CEOTodayMagazine, and Promo, while also collaborating with leading content and marketing agencies including Skale and Boosta. My portfolio spans a wide range of content types, exchange reviews, how-to guides, long-form comparisons, trend analyses, and thought leadership pieces, crafted to both inform and engage readers across different levels of expertise.
In the crypto space, I’ve developed a deep understanding of blockchain technology, digital assets, and the fast-moving decentralized finance (DeFi) ecosystem. I’ve written extensively on topics such as cryptocurrency exchanges, wallets, tokenomics, NFTs, and global regulatory developments. As a crypto investor myself, I bring a valuable firsthand perspective that allows me to balance technical accuracy with practical insights that resonate with traders, investors, and newcomers alike. Whether I’m breaking down blockchain mechanics or analyzing the latest market shifts, my work combines rigorous research, industry knowledge, and a keen sense of storytelling.
My educational background plays a key role in shaping my writing approach. I hold a Bachelor’s degree in Translation and a Master’s degree in English Literature and Teaching, disciplines that sharpened my ability to research complex subjects, distill technical information into accessible language, and adapt my tone to diverse audiences. This strong academic foundation underpins my clear, insightful, and authoritative style.
Passionate about making complex topics accessible, my mission is to cut through the jargon and deliver content that empowers readers to make informed decisions.
You can learn more about me and explore my portfolio on LinkedIn.