Monero (XMR) Price Analysis: Trends of September 12 – 18, 2018
Should the strong accumulation level of $102 get broken, the pair will experience further downward movement and get exposed to another accumulation level at $77
By Azeez Mustapha
Updated
2 mins readPhoto: Shutterstock
Key Highlights:
There is a probability of a further downtrend this week;
The price may retrace temporarily towards distribution territory of $150
Taking long position this week may be illogical.
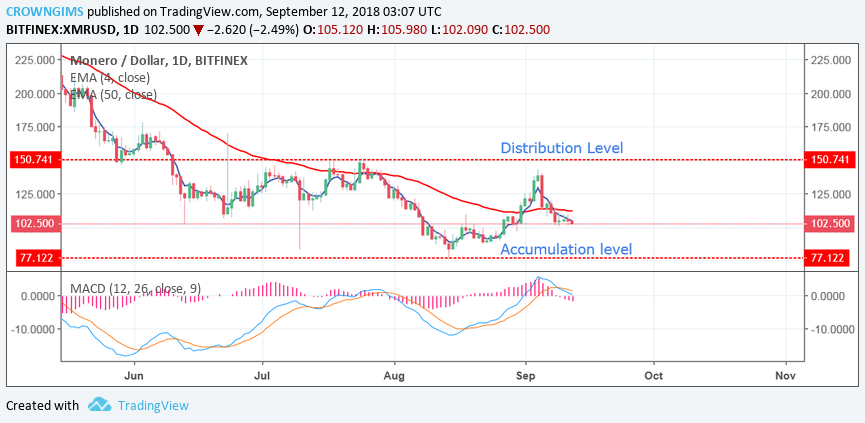
XMR/USD Long-term Trend: Bearish
Distribution Territories: $150, $178, $206
Accumulation Territories: $102, $77, $45
XMR/USD was unable to break the distribution level of $150 last week due to the formation of a bearish pin bar. It led to the downward trend with the formation of a strong bearish candle. It made the price to continue it’s downwards trending within the territories of $150 and $102. The 4-day EMA crossed the 50-day EMA downward on the daily chart with the price below 4-day EMA. Sellers are putting more pressure on the pair, and the price is sliding downwards. The price is moving away from the 50-day EMA on the Daily chart with low momentum.
Currently, the price is about to test the accumulation level of $102, a bullish retracement is possible. Should the strong accumulation level of $102 get broken, the pair will experience further downward movement and get exposed to another accumulation level at $77.
The MACD with its histogram below the zero level, and the signal lines pointing downwards indicates that the price may break the accumulation territories of $102.
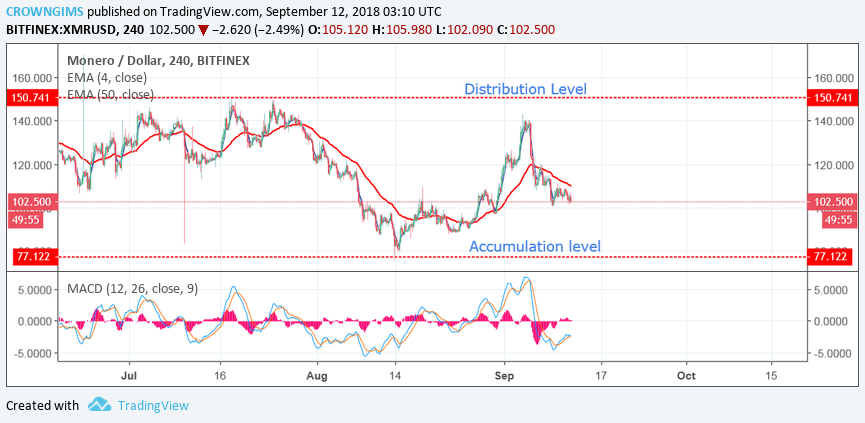
XMR/USD Price Medium-term Trend: Bearish
The cryptocurrency formed a bearish engulfing bar on the 4H chart at the distribution territories of $150 last week which made the price to bounce downward. More strong bearish candles were formed and the price has been trending downward. The price is moving away from 50-day EMA which indicates that there is a probability for the price to continue bearish movement this week. Should the coin breaks the lower distribution level of $77 further downtrend movement could be experienced. The 4-day EMA is below the 50-day EMA and the price is below 4-day EMA, suggesting the downward movement this week.
Disclaimer: The views and opinions expressed here do not reflect that of Coinspeaker.com and do not constitute financial advice. Always do your own research. The charts for the analysis are provided by TradingView
Azeez Mustapha is a specialist in Computer Studies (including DTP), Forex and Crypto trading professional. Being expert technical and currency analyst, as well as experienced fund manager and author of several books, Azeez places strong focus on crypto market studies conducting comprehensive price analyses and sharing forecasts of presumptive market trends.