Bitcoin Cash Price Analysis: BCH/USD Trends of November 14–20, 2018
Should the bears maintain or increase their pressure, the support zone of $501 will be broken and expose the support zone of $410 for Bitcoin Cash price to find its low.
By Azeez Mustapha
Updated
2 mins readPhoto: Pavlos Giorkas / Flickr
there is a probability of a further decrease in BCH price;
price pullback is inevitable.
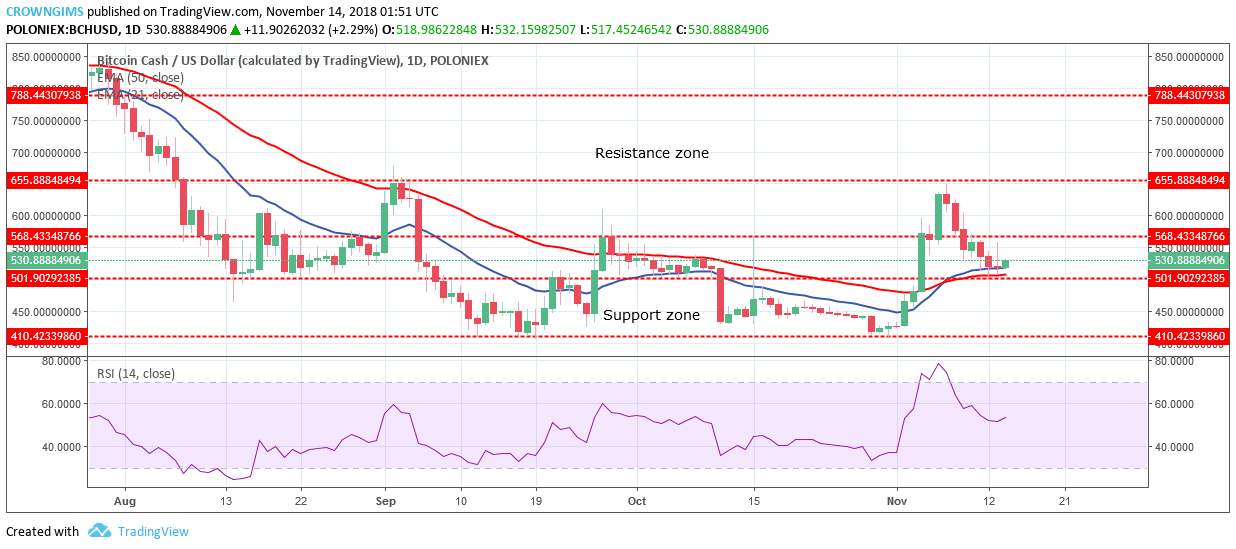
BCH/USD Price Long-term Trend: Bearish
Resistance zone: $568, $655, $788
Support zone: $501, $410, $310The cryptocurrency is bearish on the long-term outlook. On November 6, Bitcoin Cash price found its high at the resistance zone of $655. The Bulls lose the pressure and were unable to break up the resistance zone of $655. The bears took over the BCH market; this is clearly seen on the chart with the formation of bearish candles that led to the broken down of the last week support zone of $568 down to the $501 price level.
The formation of bearish pin bar candle formed on the support level of $501 (directly rest on the dynamic support and resistance of 21-day EMA and 50-day EMA) is an evidence to the bears’ strong pressure. Should the bears maintain or increase their pressure, the support zone of $501 will be broken and expose the support zone of $410 for BCH price to find its low. In case the support zone of $501 holds the price will bounce up and the bulls may take over the market for the BCH price to rally to the north and may find its high at the resistance zone of $655.
BCH/USD is directly on the 21-day EMA and 50-day EMA. Meanwhile, RSI period 14 is at the 50 levels and its signal line about turning to the north indicates a buy signal, which may be a pullback.
BCH/USD Price Medium-term Trend: Bearish
Bitcoin Cash is bearish on the 4-Hour chart, it resumed the bearish trend. The bearish engulfing candle formed at the resistance zone of $655 indicates the taken over of the market by the bears, this led to the decrease in BCH price to the broken down of the former support zone of $568 to the support zone of $501. The crossing of 21-day over 50-day EMA downside confirm the bears’ pressure.
BCH price is below the 21-day EMA and 50-day EMA which is an indication of a bearish trend. The RSI period 14 is above 40 levels and its signal line points toward north connote buy signal which may be a pullback.
Azeez Mustapha is a specialist in Computer Studies (including DTP), Forex and Crypto trading professional. Being expert technical and currency analyst, as well as experienced fund manager and author of several books, Azeez places strong focus on crypto market studies conducting comprehensive price analyses and sharing forecasts of presumptive market trends.

 The cryptocurrency is bearish on the long-term outlook. On November 6, Bitcoin Cash price found its high at the resistance zone of $655. The Bulls lose the pressure and were unable to break up the resistance zone of $655. The bears took over the BCH market; this is clearly seen on the chart with the formation of bearish candles that led to the broken down of the last week support zone of $568 down to the $501 price level.
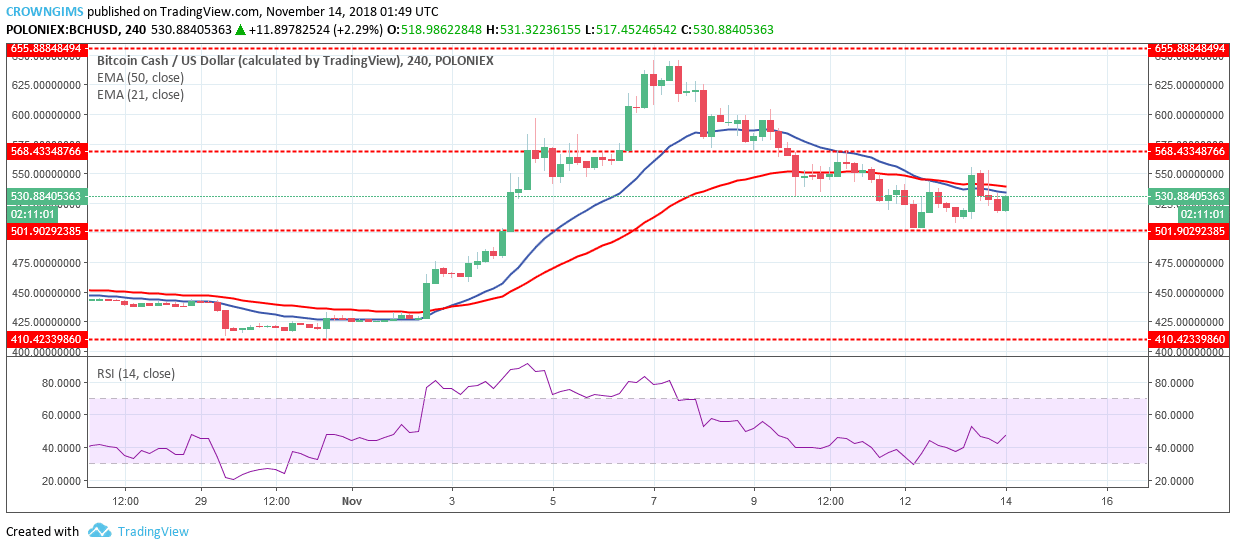 Bitcoin Cash is bearish on the 4-Hour chart, it resumed the bearish trend. The bearish engulfing candle formed at the resistance zone of $655 indicates the taken over of the market by the bears, this led to the decrease in BCH price to the broken down of the former support zone of $568 to the support zone of $501. The crossing of 21-day over 50-day EMA downside confirm the bears’ pressure.