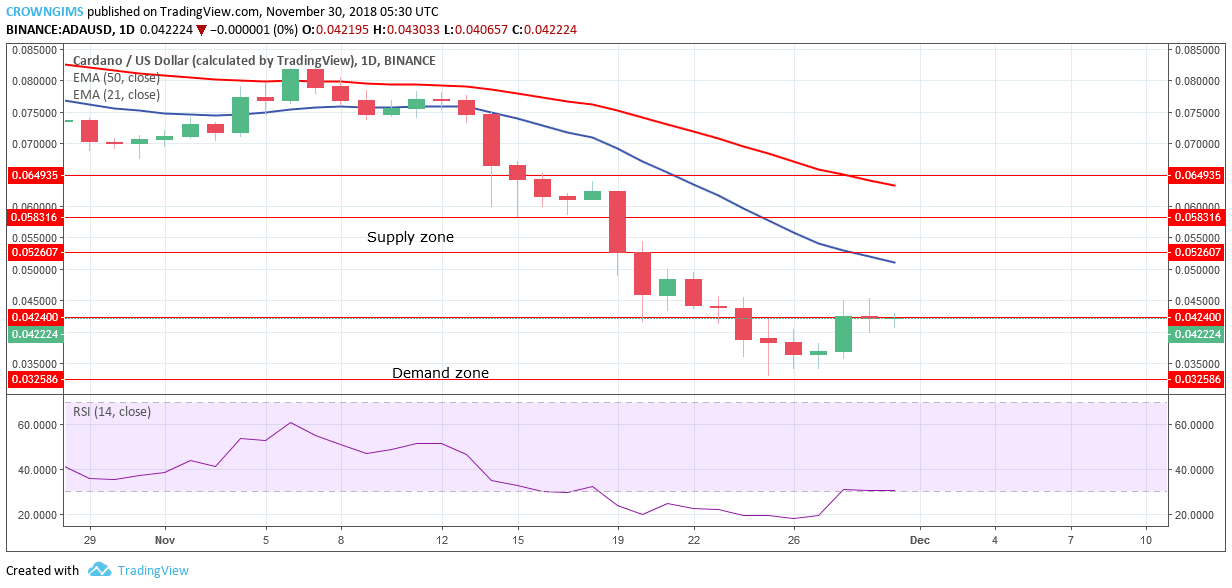
On the long-term outlook, Cardano is still in its downtrend movement. As it was predicted last week the coin bottomed at the demand zone of $0.032 after the bears broke downside the last week demand zone of $0.042. The Bears continue holding tight to the control of the ADA market last week.
There was a rejection of further decrease of ADA price at the demand zone of $0.032 as a strong bullish candle formed to push ADA price up to the broken level of $0.042 which could be price retracement.
The cryptocurrency is on the bearish trend as long as it is trading below 21-day EMA and the 50-day EMA as it can be seen on the chart. Currently, Cardano price is on the supply zone of $0.042 forming Doji candles (consolidating).
The Relative Strength Index (RSI) is at the 30 level which is parallel on the level without showing any direction indicates consolidation is ongoing. If the daily bullish candle closes above the price level of $0.042, the bulls may push the price up to the range of $0.052 and $0.058.
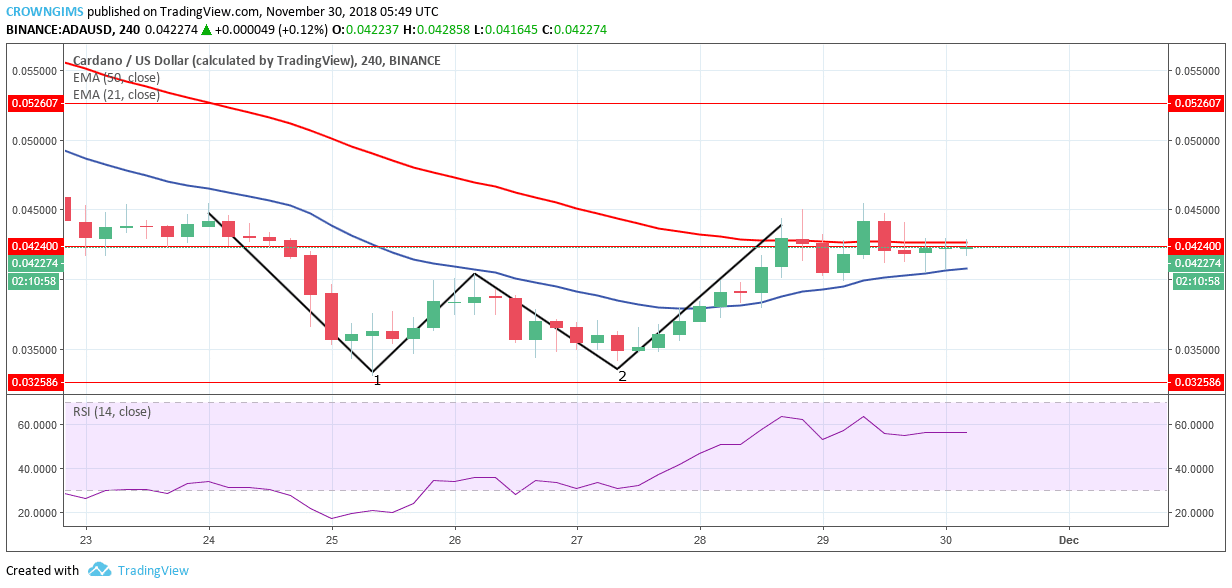
ADA/USD Price Medium-term Trend: Ranging
Cardano is ranging on the 4-Hour chart. Last week, ADA price formed double bottom pattern last week and the price was pushed up, broke the supply zone of $0.042 upside before it was interrupted by the bears and the ADA price started consolidating on the supply zone of $0.042.
ADA price is trading in between the 21-day EMA and 50-day EMA, as an evidence of consolidation the Relative Strength Index period 14 is below 60 levels parallel to the level without any direction.
Should the bears increase their momentum and form a daily bearish candle that closes below the price level of $0.042, Cardano price will resume its bearish trend which may have the price level of $0.032 – $0.030 as its target.
Azeez Mustapha is a specialist in Computer Studies (including DTP), Forex and Crypto trading professional. Being expert technical and currency analyst, as well as experienced fund manager and author of several books, Azeez places strong focus on crypto market studies conducting comprehensive price analyses and sharing forecasts of presumptive market trends.

 On the long-term outlook, Cardano is still in its downtrend movement. As it was predicted last week the coin bottomed at the demand zone of $0.032 after the bears broke downside the last week demand zone of $0.042. The Bears continue holding tight to the control of the ADA market last week.
 Cardano is ranging on the 4-Hour chart. Last week, ADA price formed double bottom pattern last week and the price was pushed up, broke the supply zone of $0.042 upside before it was interrupted by the bears and the ADA price started consolidating on the supply zone of $0.042.