 Fact-Checked by:
 16 mins
 Managing crypto token permissions is essential for DeFi wallet security. Every approval you grant persists until revoked, and unli...
Ethereum Price Prediction 2026-2036
Ethereum is trading at $2,184.27 as of March 18, 2026. Over the past 30 days, its price has moved higher, while over the last 24 hours ETH has eased back slightly.
Based on our Ethereum price prediction model, which considers recent price action, volatility, and market conditions, the token’s short-term outlook remains constructive, with the next 24-hour projection outlined below. Looking further ahead, scenario-based forecasts place ETH around $2,184.27 in 2026.
Exploring potential Ethereum price targets
In this guide, we examine Ethereum’s potential price path across short-, medium-, and long-term timeframes. Our analysis draws on factors such as historical price behavior, technical indicators, market sentiment, and macroeconomic context to predict a range of possible outcomes.
Ethereum Live Price & Market Snapshot – March 18, 2026
| Current ETH price | $2,184.27 |
| 24h change | -6.60% |
| Market cap | $262.62B |
| Circulating supply | 120.23M |
| Total supply | 120.23M |
| All-time high | $4,946.23 |
Ethereum has demonstrated firmer momentum over the past week, which suggests traders have been willing to pay up for risk again. Over a 30-day window, the broader trend leans constructive, with buyers absorbing dips.
Zooming out, ETH’s price action is also tied to how the network is being used. EIP-1559 burns part of Ethereum’s transaction fees, and validators stake ETH to secure the chain, so supply dynamics can look different from cycle to cycle. On the demand side, Ethereum remains a core settlement layer for DeFi activity and stablecoins.
Put together, the setup is tilted toward continuation if risk sentiment holds. None of this eliminates volatility, but ETH has multiple fundamental catalysts to support a recovery when conditions improve.
Quick Forecast – Ethereum Price Predictions at a Glance
To map out ETH’s ETH $2 213 24h volatility: 5.4% Market cap: $266.13 B Vol. 24h: $20.19 B potential price ranges over the next ten years, we combined historical price behavior with technical signals, volatility, market conditions, and scenario assumptions used in our forecasting model. The table below summarizes our modeled low, average, and high outcomes for 2026, 2030, and 2036:
| Year | Potential Low | Average | Potential High |
| 2026 | $2,184.27 | $2,184.27 | $2,184.27 |
| 2030 | $2,653.73 | $3,195.08 | $3,815.32 |
| 2036 | $2,969.05 | $3,999.05 | $5,340.18 |
These ranges are meant to frame uncertainty rather than pin down a single “target.” For example, the potential low reflects a conservative case in which macro conditions remain restrictive, risk appetite remains muted, or Ethereum usage cools.
The average is a baseline path derived from the current market structure and observed volatility. Lastly, the potential high assumes several tailwinds line up, such as stronger liquidity, improving macro conditions, and sustained demand for Ethereum blockspace (directly on Layer 1 and via Layer 2 activity).
Ethereum Short-Term Price Outlook (Next 30 Days)
Over the last week, Ethereum’s price increased to $2,184.27 (+5.72%). In the past month, it maintained upward momentum.
| Date | Potential Low | Average Price | Potential High |
|---|---|---|---|
| March 19, 2026 | $2,184.66 | $2,185.03 | $2,187.90 |
| March 20, 2026 | $2,185.06 | $2,185.81 | $2,191.58 |
| March 21, 2026 | $2,185.46 | $2,186.57 | $2,195.24 |
| March 22, 2026 | $2,185.85 | $2,187.34 | $2,198.86 |
| March 23, 2026 | $2,186.24 | $2,188.09 | $2,202.45 |
| March 24, 2026 | $2,186.64 | $2,188.88 | $2,206.22 |
| March 25, 2026 | $2,187.03 | $2,189.63 | $2,209.75 |
| March 26, 2026 | $2,187.43 | $2,190.40 | $2,213.45 |
| March 27, 2026 | $2,187.82 | $2,191.16 | $2,217.07 |
| March 28, 2026 | $2,188.20 | $2,191.90 | $2,220.57 |
| March 29, 2026 | $2,188.62 | $2,192.73 | $2,224.52 |
| March 30, 2026 | $2,188.97 | $2,193.41 | $2,227.74 |
| March 31, 2026 | $2,189.39 | $2,194.23 | $2,231.64 |
| April 1, 2026 | $2,189.80 | $2,195.02 | $2,235.44 |
| April 2, 2026 | $2,190.18 | $2,195.75 | $2,238.88 |
| April 3, 2026 | $2,190.60 | $2,196.57 | $2,242.81 |
| April 4, 2026 | $2,190.97 | $2,197.29 | $2,246.22 |
| April 5, 2026 | $2,191.33 | $2,197.99 | $2,249.54 |
| April 6, 2026 | $2,191.75 | $2,198.81 | $2,253.44 |
| April 7, 2026 | $2,192.14 | $2,199.56 | $2,257.01 |
| April 8, 2026 | $2,192.53 | $2,200.32 | $2,260.64 |
| April 9, 2026 | $2,192.90 | $2,201.04 | $2,264.04 |
| April 10, 2026 | $2,193.29 | $2,201.80 | $2,267.67 |
| April 11, 2026 | $2,193.76 | $2,202.71 | $2,271.99 |
| April 12, 2026 | $2,194.09 | $2,203.36 | $2,275.10 |
| April 13, 2026 | $2,194.50 | $2,204.14 | $2,278.83 |
| April 14, 2026 | $2,194.90 | $2,204.93 | $2,282.56 |
| April 15, 2026 | $2,195.25 | $2,205.61 | $2,285.79 |
| April 16, 2026 | $2,195.73 | $2,206.55 | $2,290.27 |
| April 17, 2026 | $2,196.09 | $2,207.25 | $2,293.59 |
Near-term price action is likely to hinge on a familiar mix: macro headlines, policy tone, and whether Ethereum’s scaling narrative continues to feel “real” to traders. On the protocol side, Ethereum is coming off the Fusaka hard fork in December 2025, while core developers continue rehearsals and testing for the next upgrade cycle.
The largest upcoming volatility events are related to macro factors. The Federal Reserve meets January 27-28, and language around inflation and future cuts tends to hit ETH hard because it trades like a high-beta risk asset during rate-sensitive periods. Also, the next CPI print on February 11 is another major checkpoint, since any surprise in inflation data can move yields (and yields often set the tone for crypto flows).
Regulation is another wildcard. US lawmakers are actively debating a market structure framework, but the expected timeline has already changed multiple times. As a result, even without a definitive decision, news reports can influence spot and derivatives trading positions.
Finally, keep an eye on Ethereum-adjacent supply events: Arbitrum’s ARB unlock on January 16, and other large exchange-token unlocks later in the month can pressure risk appetite across the market. That pressure often spills into ETH even when Ethereum-specific news flow is quiet.
Ethereum Medium-Term Forecast 2026-2027
Over the coming year, three forces will likely affect ETH’s price: how smoothly the Glamsterdam and Hegota hard forks roll out, whether staking-integrated ETFs continue to attract institutional capital, and the direction of Fed policy across several FOMC meetings.
Here’s our Ethereum price forecast through 2026:
| Month | Potential Low | Average Price | Potential High |
|---|---|---|---|
| April 2026 | $2,196.61 | $2,208.96 | $2,221.30 |
| May 2026 | $2,208.91 | $2,233.55 | $2,258.19 |
| June 2026 | $2,221.23 | $2,258.19 | $2,295.14 |
| July 2026 | $2,233.40 | $2,282.53 | $2,331.66 |
| August 2026 | $2,245.68 | $2,307.09 | $2,368.51 |
| September 2026 | $2,258.41 | $2,332.55 | $2,406.68 |
| October 2026 | $2,270.51 | $2,356.74 | $2,442.98 |
| November 2026 | $2,282.43 | $2,380.59 | $2,478.75 |
| December 2026 | $2,295.70 | $2,407.13 | $2,518.56 |
| January 2027 | $2,307.09 | $2,429.92 | $2,552.74 |
| February 2027 | $2,319.92 | $2,455.57 | $2,591.22 |
| March 2027 | $2,331.95 | $2,479.64 | $2,627.32 |
If the current momentum continues, ETH could extend its half-year gains and test key resistance levels by mid-2026.
The biggest milestone to watch is the Glamsterdam hard fork, expected sometime this year. This upgrade introduces ePBS (Enshrined Proposer-Builder Separation) to reduce validator centralization and adds Access Lists to optimize state access. After that, the Hegota upgrade targets state bloat and aims to push the Layer 1 gas limit from roughly 60 million to over 180 million.
Institutional flows matter too. In the US, several spot ETH ETFs began distributing staking rewards in early 2026 following SEC rule changes, creating the first yield-bearing crypto ETF available to the public.
Lastly, Morgan Stanley has filed for separate spot ETF products tied to Bitcoin, Ethereum, and Solana, marking one of the first times a major U.S. bank has sought direct exposure across multiple crypto assets. This move signals that institutional portfolios are broadening beyond Bitcoin alone.
Ethereum Long-Term Price Forecast 2026-2036
Between now and 2036, Ethereum’s trajectory will largely depend on whether it can evolve from a dApp platform into the global settlement layer for tokenized finance, handling trillions of dollars in RWAs, stablecoins, and institutional transactions.
Here’s our 10-year ETH price forecast:
| Year | Potential Low (ROI) | Average Price (ROI) | Potential High (ROI) |
|---|---|---|---|
| 2027 | $2,313.64 (5.92%) | $2,443.00 (11.85%) | $2,572.37 (17.77%) |
| 2028 | $2,436.26 (11.54%) | $2,702.01 (23.70%) | $2,981.51 (36.50%) |
| 2029 | $2,550.24 (16.75%) | $2,954.97 (35.28%) | $3,400.40 (55.68%) |
| 2030 | $2,653.73 (21.49%) | $3,195.08 (46.28%) | $3,815.32 (74.67%) |
| 2031 | $2,744.97 (25.67%) | $3,415.32 (56.36%) | $4,210.67 (92.77%) |
| 2032 | $2,822.36 (29.21%) | $3,608.76 (65.22%) | $4,569.85 (109.22%) |
| 2033 | $2,884.49 (32.06%) | $3,768.93 (72.55%) | $4,876.32 (123.25%) |
| 2034 | $2,930.20 (34.15%) | $3,890.16 (78.10%) | $5,114.79 (134.16%) |
| 2035 | $2,958.58 (35.45%) | $3,967.92 (81.66%) | $5,272.48 (141.38%) |
| 2036 | $2,969.05 (35.93%) | $3,999.05 (83.08%) | $5,340.18 (144.48%) |
If adoption continues at the current pace, ETH is positioned to benefit from compounding network effects and deepening institutional allocation by 2030.
The biggest technical milestone on the horizon is quantum resistance. Vitalik Buterin has flagged a 20% risk that quantum computers will break existing cryptography by 2030, prompting plans to implement NIST-approved post-quantum signature schemes.
Beyond security, Ethereum’s Verge and Purge phases (2027–2032) will introduce Verkle Trees for stateless clients, enabling nodes to run on smartphones. These phases will also prune historical data older than one year to keep hardware requirements low.
Institutional adoption is another long-term catalyst. BlackRock and Deutsche Bank are already building on Ethereum, and by 2036, the network could serve as the backend for global bond and equity settlement. Some analysts even see smaller sovereign wealth funds adopting ETH as a yield-bearing digital reserve asset.
Supply dynamics reinforce the bull case. EIP-1559’s burn mechanism, combined with staking lockups, could meaningfully lower Ethereum’s circulating supply if Layer 2 activity drives high Layer 1 settlement demand. In turn, tightening supply may create an imbalance that amplifies ETH’s price fluctuations.
Our model suggests an average price of $3,195.08 in 2030 with a potential high of $3,815.32 and potential low of $2,653.73.
Methodology for Price Predictions
Our ETH price prediction is based on several different layers of analysis:
- Historical price analysis: We review Ethereum’s past bull and bear cycles, short-term volatility patterns, and long-term price trends.
- Market sentiment: We track trader sentiment on social media, crypto news outlets, prediction markets, and analyst commentary, adjusting scores based on news flow.
- Volatility analysis: We measure price volatility across 1-day, 7-day, 180-day, and 3-year periods to calibrate short- and long-term risk.
- Technical analysis: We use popular indicators (simple moving averages (SMA), relative strength index (RSI), MACD, and trendline analysis) to identify likely price direction.
- Fundamental analysis: We assess Ethereum’s network fundamentals, including developer activity, Layer 2 TVL, staking participation, and EIP-1559 burn dynamics.
- Macroeconomic projections: We factor in interest rates, inflation, and broader risk sentiment.
Prediction Scenarios
Instead of just providing a single price target, we opt for a range-based approach:
- Potential Low: A conservative estimate that assumes bearish conditions, things like regulatory friction or macro headwinds.
- Average: The most likely outcome based on current market structure and trends.
- Potential High: An optimistic scenario where multiple key catalysts (staking ETF inflows, successful upgrades) all line up.
Our framework accounts for uncertainty while providing best-case and worst-case bounds. These bounds are merely directional indicators, so use them alongside your own research.
What Analysts Predict
Several banks and analysts have issued positive Ethereum price forecasts. Here are four of the most eye-catching:
- Standard Chartered’s team believes Ethereum will hit $7,500 by the end of 2026, rising to $15,000 in 2027 and $40,000 by 2030. Geoffrey Kendrick, the bank’s Global Head of Digital Assets Research, calls 2026 “the year of Ethereum”.
- VanEck sets a base-case target of $22,000 by 2030, with a bull case of $154,000 and a bear case of $360. Their model treats ETH as “digital oil”, assuming Ethereum maintains roughly 90% market share in smart-contract platforms.
- Tom Lee (Fundstrat) argues ETH could trade above $20,000 within the coming year if Wall Street’s tokenization push accelerates. His thesis focuses on Ethereum hosting over 70% of tokenized real-world asset value.
- Ark Invest models a cycle-level target of around $8,000 for the mid-2020s, with a long-term upper-bound scenario near $180,000. Cathie Wood’s team ties these figures to staking-ETF rollout, large-scale RWA tokenization, and clearer regulatory frameworks.
The spread of analyst predictions reflects the uncertainty about how much of global finance will ultimately settle on Ethereum.
Bullish vs Bearish Scenarios
To understand where ETH could go in the years ahead, it helps to map out specific catalysts and risks that could move the token’s price up or down:
Bullish Catalysts:
- ETF inflows: US spot Ethereum ETFs have attracted sustained institutional capital since launching, with BlackRock’s ETHA consistently leading inflows. The pattern of minimal daily outflows in early 2026 suggests institutions are building long-term positions rather than flipping for quick profits.
- Regulatory clarity: The CLARITY Act, which lawmakers expect to pass this year, would classify ETH as a commodity subject to CFTC oversight. A stablecoin bill is also on deck, formalizing Ethereum’s role as the primary settlement layer for dollar-pegged tokens.
- Institutional adoption: JPMorgan launched a tokenized money market fund on Ethereum in late 2025. Also, BlackRock’s January 2026 report declared stablecoins “no longer niche”.
- Network upgrades: The Glamsterdam and Hegota hard forks target increases in the gas limit to 180–200 million and improved parallel processing. These upgrades will expand capacity for high-performance dApps.
Bearish Risks:
- Macro headwinds: J.P. Morgan assigns a 35-40% probability of a US or global recession in 2026. If the Fed pauses rate cuts or resumes tightening due to sticky inflation, risk assets (like ETH) face pressure.
- Security risks: Ethereum suffered an estimated $2.28 billion in losses from security incidents in 2025 – the highest among public blockchains.
- Developer stagnation: The Ethereum Foundation paused grant applications for its Ecosystem Support Program in August 2025, suggesting a pivot away from broad developer funding.
Unknown Variables
Black swan events, by their very nature, remain impossible to predict but could hit Ethereum hard. As touched on earlier, Vitalik Buterin has flagged a 20% risk that quantum computers will break existing cryptography by 2030. However, Ethereum developers expect to complete the post-quantum migration by 2028-2030.
Should You Invest in Ethereum?
Our ETH price prediction points to long-term upside, but that doesn’t automatically mean you should invest in it. You must first consider your risk tolerance. ETH is highly volatile – late 2025’s price swings proved that. If you’re unable to weather movement like that, then this token probably isn’t for you.
Consider your time horizon, too. Ethereum has experienced multiple bear markets over the past 10 years and will likely do so again. So if you need liquidity instantly, locking capital into a high-beta crypto (like ETH) carries risk.
Also, consider your existing crypto portfolio. ETH correlates strongly with BTC and tech stocks. If you’re already heavy in NASDAQ or Bitcoin, adding ETH doesn’t diversify much. In fact, adding ETH amplifies your exposure to the same macro forces.
Ethereum Price Chart and Historical Performance
Ethereum went live in 2015 as a programmable blockchain that enabled developers to build dApps. ETH’s price history since then mirrors crypto’s boom-bust cycles – but with ETH-specific catalysts at each turning point.
The token’s first major rally came during the 2017 ICO boom. ETH surged from roughly $8 in January 2017 to around $1,400 by January 2018 as thousands of projects raised capital through ERC-20 token sales. But the crash that followed later that year dragged ETH below $90.
After sideways accumulation through most of 2019, the March 2020 COVID panic briefly crashed ETH as traders rushed to cash out. Yet DeFi summer changed everything. Protocols like Uniswap, Aave, and Compound turned ETH into essential collateral, pushing the token’s price to $730 by year-end.
Then, in the 2021 cycle, ETH reached an all-time high near $4,800 by November, thanks in part to institutional interest, NFT (non-fungible tokens) mania, and the London hard fork (EIP-1559), which introduced base-fee burning and the “ultrasound money” narrative. The subsequent crypto winter – driven by macro tightening, Terra’s collapse, and FTX’s bankruptcy – dragged ETH back to around $1,000 by late 2022.
The September 2022 Merge, transitioning Ethereum from proof-of-work to proof-of-stake, was a huge milestone. By 2023, ETH had recovered toward $2,500 as confidence in the developers’ roadmap returned. That momentum carried into 2024–2025, with spot Ethereum ETFs launching in the US and ETH climbing past $4,000, solidifying it as one of the best altcoins to buy for those seeking exposure to smart contract infrastructure.

Ethereum (ETH)
24h7d30d1yAll time
ETH is trading at $2,184.27 as of March 18, 2026.
Ethereum Technical Analysis and Key Indicators
Technical analysis helps traders understand price trends and momentum. It can’t predict the future, but it can offer context for where an asset sits within its broader trend.
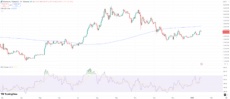
ETH/USDT daily price chart with 200-day SMA and 14-day RSI. Source: TradingView
The chart above shows ETH’s price with the 200-day simple moving average (SMA) and the 14-day relative strength index (RSI). The 200-day SMA plots Ethereum’s average price over roughly six months and often acts as a key support or resistance level.
ETH is trading below this line (around $3,315 vs. the SMA at ~$3,650), which traders generally interpret as short-term weakness. For the trend to flip bullish, ETH would need to reclaim and hold above this SMA, which typically requires a meaningful catalyst (like a major network upgrade).
The RSI measures momentum on a scale of 0–100. Readings above 70 suggest overbought conditions; below 30 indicate oversold. ETH’s RSI sits around 63, which is neutral-to-slightly-bullish territory. It’s not stretched enough to signal exhaustion, but it’s not flashing a buy Ethereum signal either. That neutral reading suggests the market is consolidating.
US and Global Regulatory & Tax Considerations
- United States: The IRS taxes ETH as property. Short-term gains (held <1 year) are taxed as ordinary income (10-37%); long-term gains are taxed at 0%, 15%, or 20% depending on income bracket. Staking rewards are taxed as ordinary income when received.
- European Union: MiCA creates an EU-wide licensing framework for crypto-asset service providers. Tax treatment varies by country. Germany exempts holdings over one year; France doesn’t tax crypto-to-crypto swaps. ETH trades on Bitpanda, Kraken EU, and Binance.
- United Kingdom: HMRC treats ETH as property subject to capital gains tax (10–20%). FCA-registered exchanges include Coinbase UK and Kraken.
- Asia-Pacific: Japan taxes crypto gains as miscellaneous income up to 55%. Singapore has no capital gains tax for individuals. Australia applies capital gains tax with a 50% discount to capital gains on holdings held for more than 12 months.
Forecasts represent possible scenarios based on current information, not guarantees. Crypto markets are highly volatile and unpredictable. Past performance does not indicate future results.
FAQ
What will Ethereum be worth in 2026?
Can Ethereum reach $10,000?
Is Ethereum a good investment?
How accurate are crypto price predictions?
What factors affect Ethereum’s price?
Where can I buy Ethereum?
References
- Ethereum Fusaka Upgrade: Everything you need to know (Consensys)
- Morgan Stanley Files for Multiple Spot Crypto ETFs, Strategy Adds to Bitcoin Stockpile, and PwC Signals Broader Crypto Push (Gemini)
- Ethereum Roadmap – Verkle Trees (Ethereum.org)
- EIP-1559: Fee market change for ETH 1.0 chain (Ethereum.org)
- Total Ethereum Spot ETF Net Inflow/Outflow (Coinglass)
- Stablecoins no longer niche, pose challenge to fiat and banking (KuCoin)
- 2026 market outlook: A multidimensional polarization (JPMorgan)
- 2025 Blockchain Security Situation Annual Report (lunaray.Medium.com)
Coinspeaker in Numbers
250K+
Monthly Users
80+
Articles & Guides
5000+
Research Hours
23
Authors
guides
How to Revoke Crypto Token Permissions in 2026?
March 13th, 2026
How to Keep Your Crypto Safe in 2026: Guide For Traders
March 6th, 2026
LiquidChain (LIQUID) Price Prediction 2026, 2027, and 2030
February 4th, 2026
Crypto theft is more common than most traders think, and it rarely takes a sophisticated hack. A forgotten token approval, a poorl...
LiquidChain is a Layer 3 blockchain project that wants to unify the liquidity of Bitcoin, Ethereum, and Solana into a single execu...
Otar Topuria
Crypto Editor, 41 postsI’m a crypto writer and analyst at Coinspeaker with over three years of experience covering fintech and the rapidly evolving cryptocurrency landscape. My work focuses on market movements, investment trends, and the narratives driving them, helping readers what is happening in the markets and why. In addition to Coinspeaker, my insights and analyses have been featured in other leading crypto and fintech publications, where I’ve built a reputation as a thoughtful and reliable voice in the industry.
My mission is to demystify the crypto markets and help readers navigate the noise, highlighting the stories and trends that truly matter. Before specializing in crypto, I worked in the IT sector, writing technical content on software development, digital innovation, and emerging technologies. That made me something of an expert in breaking down complex systems and explaining them in a clear, accessible way, skills I now find very useful when it comes to unpacking the intricate world of blockchain and digital assets.
I hold a Master’s degree in Comparative Literature, which sharpened my ability to analyze patterns, draw connections across disciplines, and communicate nuanced ideas. I’m particularly passionate about early-stage project discovery and crypto trading, areas where innovation meets opportunity. I enjoy exploring how new protocols, tokens, and DeFi projects aim to disrupt traditional systems, while also evaluating their potential risks and rewards. By combining market analysis with forward-looking research, I strive to provide readers with content that is both informative and actionable.