Monero (XMR) Price Analysis: Trends of August 22–28, 2018
Taking long trades is not advisable at the moment because the long-term trend is bearish, and the bearish pressure may continue for some time.
By Azeez Mustapha
Updated
2 mins readPhoto: Shutterstock
Key Highlights:
Further downwards movement confirmed in the Monero 4-Hour chart;
there is a probability for price breaking out of the resistance level of $105;
taking short trades is advisable.
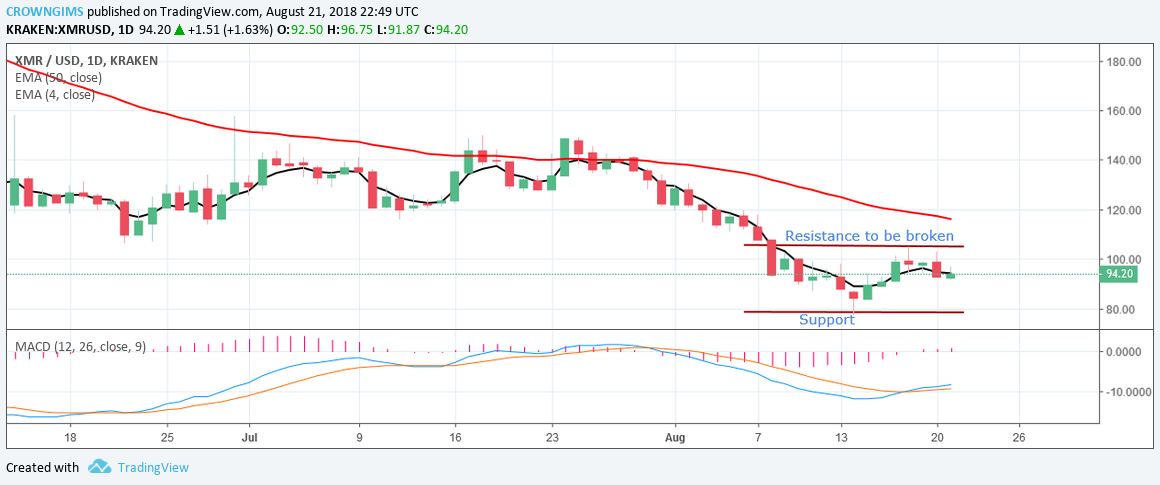
XMR/USD Long-term Trend: Bearish
Resistance levels: $105, $120, $130,
Support levels: $77, $67, $56
Monero broke the resistance level of $105 and moved downside to the deep support level of $77. This price level ($77) was reached last year September 15, before it moved upward. Last week a bullish Pin bar formed at the support level of $77 moved the price upward towards the resistant level of $105. The 4-day EMA moved upward with the price towards the 50-day EMA. The price could not break the resistance level of $105.
Now, it forms another bearish candle as the price moves close to the strong support level at $77. Should the strong support level get broken, the pair will drop further and get exposed to another strong support level at $67. The MACD, with its histogram below the zero level, indicates that the price may slide further downwards.
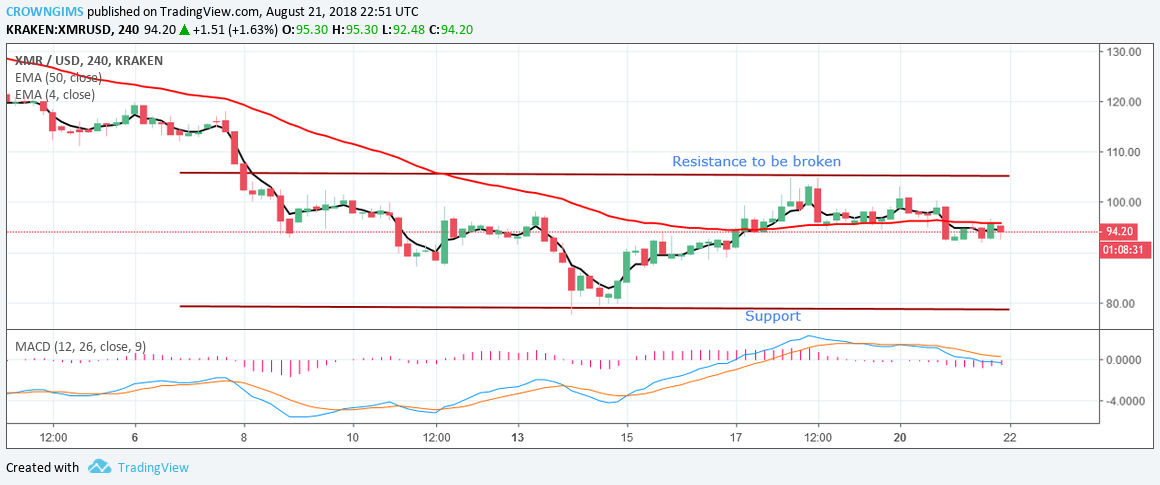
XMR/USD Price Medium-term Trend: Bearish
Recently, the cryptocurrency tried to break upwards but more sellers came in at the resistance level of $105, and price slid further southwards. In the 4-hour chart, the price is below the 4-day EMA, which connotes the possibility of a downwards trend continuation.
XMR/USD has been very bearish, making higher lows and lower lows in the channel within the levels of $105 and $77. Taking long trades is not advisable at the moment as the MACD in the 4-hour chart also supports short trades. XMR may break out to the upper trend lines and expose the price to another resistance level of $120.
Azeez Mustapha is a specialist in Computer Studies (including DTP), Forex and Crypto trading professional. Being expert technical and currency analyst, as well as experienced fund manager and author of several books, Azeez places strong focus on crypto market studies conducting comprehensive price analyses and sharing forecasts of presumptive market trends.

 Recently, the cryptocurrency tried to break upwards but more sellers came in at the resistance level of $105, and price slid further southwards. In the 4-hour chart, the price is below the 4-day EMA, which connotes the possibility of a downwards trend continuation.