Stellar Price Analysis: XLM/USD Trends of February 21–27, 2019
Further increase in the bulls’ momentum will break the confluence at $0.09 and the crypto will target $0.12 supply level. In case the confluence at $0.09 level holds, then, Stellar may range back to the previous low.
By Azeez Mustapha
Updated
2 mins readPhoto: Shutterstock
Key Highlights:
The bull took over Stellar market on 4-Hour chart;
the breakup of $0.09 level will expose $0.1 price level;
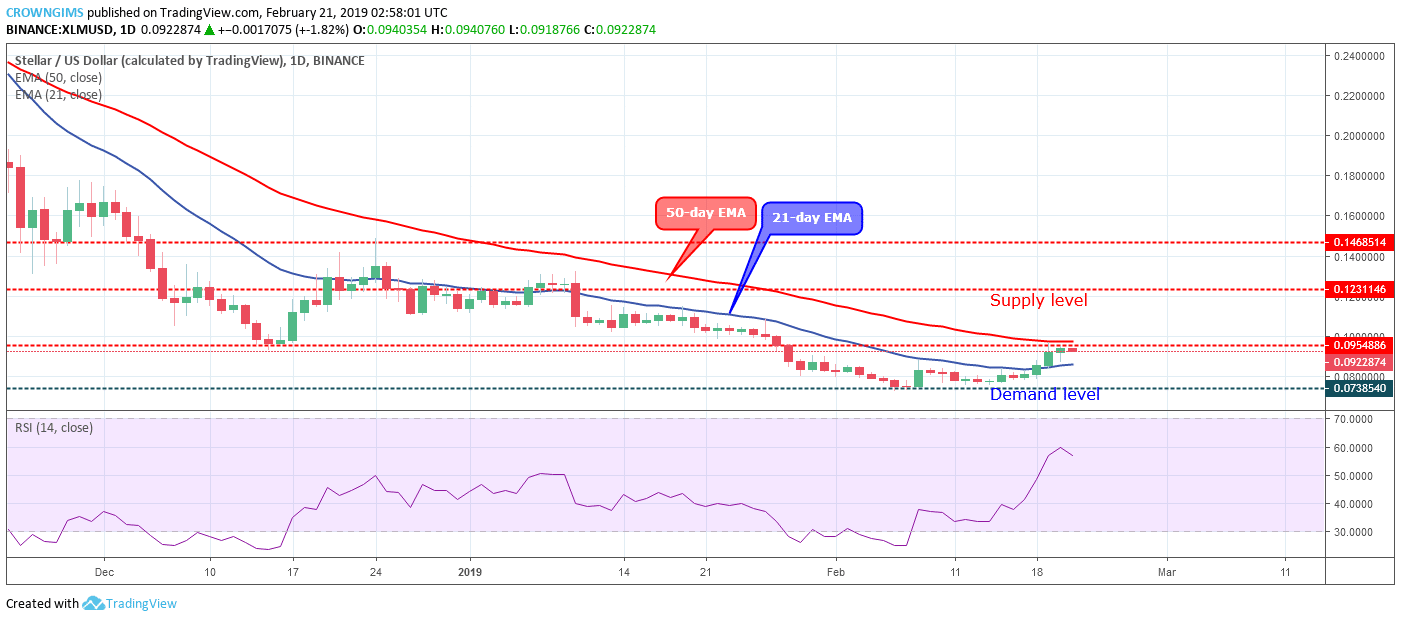
XLM/USD remains in its bearish trend on the long-term outlook. AS long as the cryptocurrency remains below the 21-day or 50-day EMA the bearish trend is in place; that is the scenario of Stellar price on the Daily chart for more than two weeks now.
The slow bearish momentum bottomed the coin at $0.07 demand levels on the February 7. An attempt was made by the Bulls to push the coin up but it was resisted at dynamic resistance of 21-day EMA and returned to the previous low. The second attempt by the bulls was in a slow and steady bullish momentum broke up the 21-day EMA and currently facing/confronting with 50-day EMA at $0.09 supply level.
Stellar price is trading in between the 21-day EMA and 50-day EMA, with the 21-day EMA gradually bending towards 50-day EMA as a sign of an increase in bullish momentum. The Relative Strength Index period 14, is at 60 levels with the signal line pointing down which implies sell signal that may be for short period.
Further increase in the bulls’ momentum will break the confluence at $0.09 and the crypto will target $0.12 supply level. In case the confluence at $0.09 level holds, then, the coin may range back to the previous low.
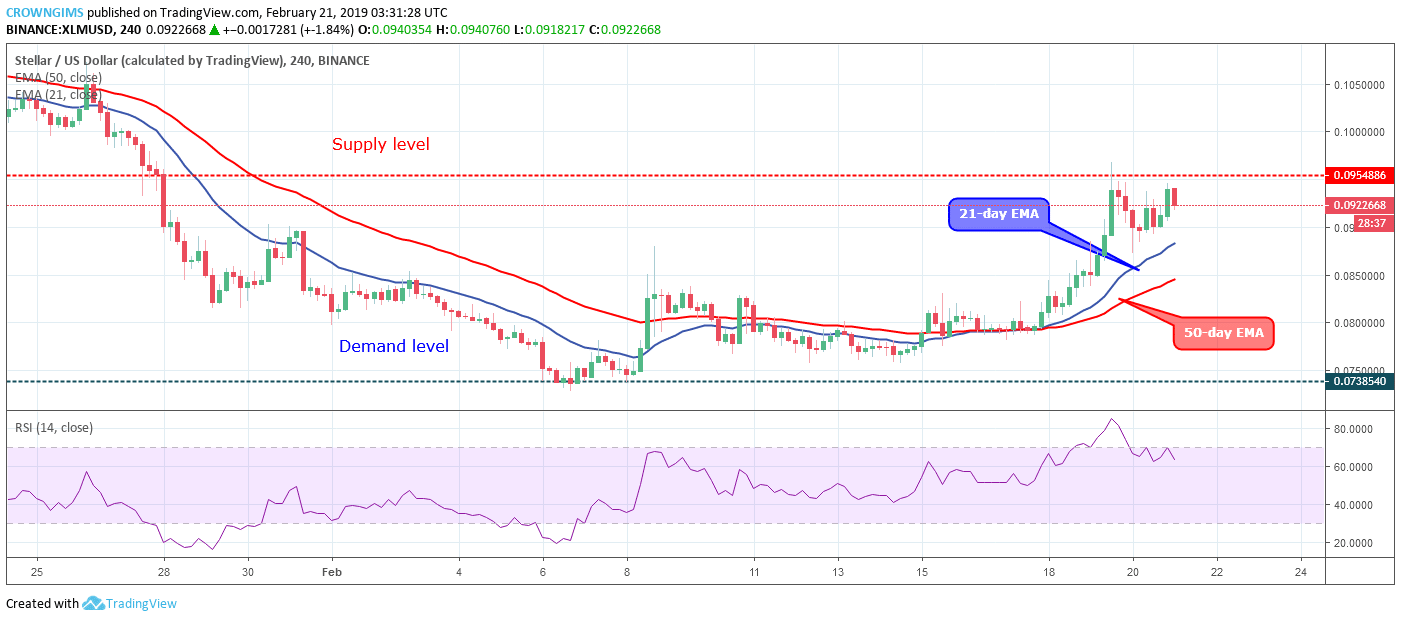
XLM/USD Price Medium-term Trend: Bullish
XLM/USD is bullish on the 4-Hour chart. Stellar price was on the ranging mode last two weeks. The scenario in which the momentum of both the Bears and the Bulls were equal. Last week, the Bulls were able to break out of the consolidation mode by gaining more pressure that propelled the crypto towards the supply level of $0.09 with the formation of strong bullish candles.
Further increase of the bulls’ momentum will break up the supply level of $0.09 and $0.12 supply level will be exposed.
The XLM price is above the 21-day EMA and 50-day EMA which indicates that the bulls are in control of the XLM market. However, the Stochastic Oscillator period 14 is at 60 levels with the signal line point down which connotes sell and it may be a pullback.
Azeez Mustapha is a specialist in Computer Studies (including DTP), Forex and Crypto trading professional. Being expert technical and currency analyst, as well as experienced fund manager and author of several books, Azeez places strong focus on crypto market studies conducting comprehensive price analyses and sharing forecasts of presumptive market trends.