WLD dropped 8% in 24 hours, wiping $120 million in market cap.
Whales withdrew $17.17 million in WLD from Binance, reducing exchange liquidity.
Price action shows bearish pressure, but the long-term breakout remains intact.
Worldcoin WLD$0.3224h volatility:4.5%Market cap:$999.77 MVol. 24h:$130.41 M
tumbled nearly 8% in the past 24 hours, dropping to around $0.9344 at the time of writing. The market capitalization has plummeted by $120 million over the same period, now sitting at around $1.52 billion.
While retail traders appeared worried by this downturn, blockchain data indicates that whales are quietly accumulating. According to LookonChain, two newly created wallets withdrew a combined 18.2 million WLD worth around $17.17 million from Binance.
The large-scale withdrawal reduces exchange liquidity, often leading to heightened price swings or preparation for OTC (over-the-counter) deals. Analysts suggest that this could mark the early signs of a bottom forming.
In the short term, WLD remains under bearish pressure. The token has shed nearly 18% over the past month, wiping out roughly $900 million in market capitalization since May 22. Technical analyst AltCryptoTalk noted that WLD broke below a rising wedge pattern on the daily chart last week.
The analyst believes that the price could retest the horizontal support level at $0.50. Should this level hold, traders may look to re-enter with targets near $1.50.
However, zooming out to the longer-term picture, WLD appears to have broken out of a multi-month falling wedge pattern in April. This hints at a potential macro rally if supported by volume and momentum.
🚨 $WLD looks ready to explode Indicators flashing bullish: ✅ RSI momentum picking up ✅ Major falling wedge breakout ✅ Long-term structure looks primed People still sleeping on @worldcoin while it’s building real-world utility. 📈 Buy before it runs. Let $WLD cook good steak🔥 pic.twitter.com/nR1nn6zYHk
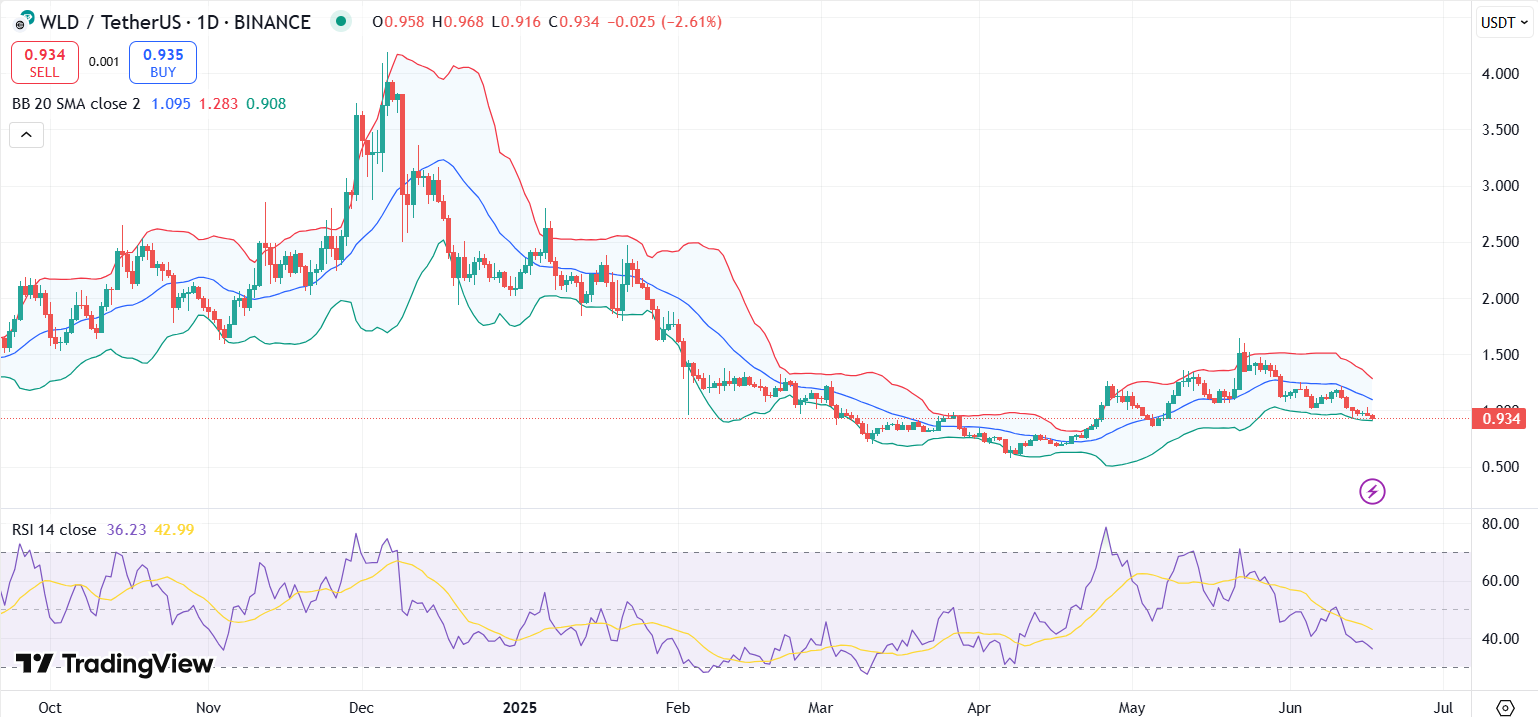
On the daily WLD price chart, the RSI is currently signaling oversold conditions. A further dip would suggest stronger bearish momentum, but the current level may entice buyers to enter.
WLD price chart with RSI and Bollinger Bands | Source: TradingView
Bollinger Bands are beginning to shrink, suggesting declining volatility. Moreover, the price has broken below the lower band. A close above the $1.10 resistance level could lead to bullish continuation.
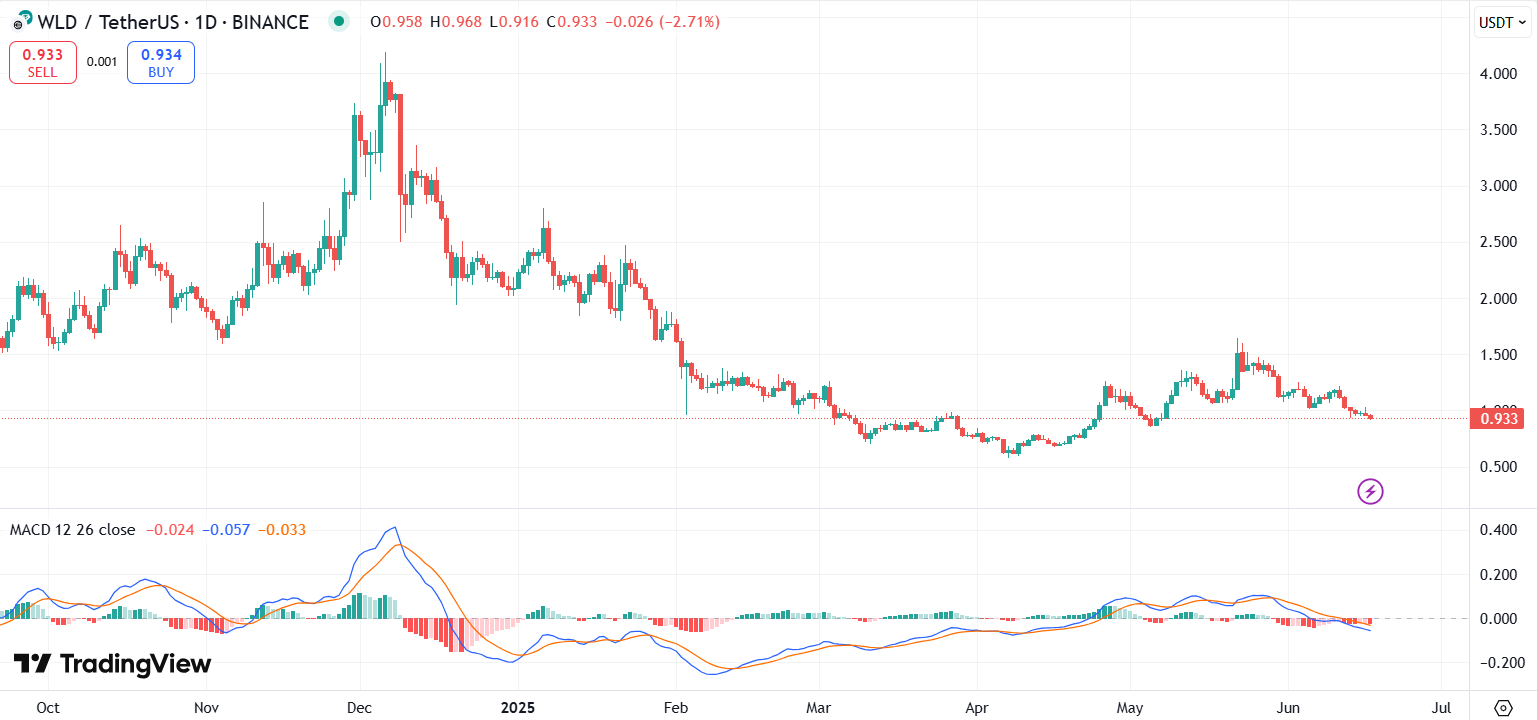
WLD price chart with MACD | Source: TradingView
Meanwhile, the MACD shows a bearish crossover with the MACD line crossing below the signal line. Both lines are below the zero level, reinforcing downward pressure. Traders could see strong support around $0.90 and $0.50.
Disclaimer: Coinspeaker is committed to providing unbiased and transparent reporting. This article aims to deliver accurate and timely information but should not be taken as financial or investment advice. Since market conditions can change rapidly, we encourage you to verify information on your own and consult with a professional before making any decisions based on this content.
A crypto journalist with over 5 years of experience in the industry, Parth has worked with major media outlets in the crypto and finance world, gathering experience and expertise in the space after surviving bear and bull markets over the years. Parth is also an author of 4 self-published books.