Whale wallets have added over 500,000 ETH in two weeks.
ETH spot ETFs see record inflows, signaling rising institutional demand.
Ethereum ETH$3 75824h volatility:3.2%Market cap:$453.33 BVol. 24h:$54.52 B
dropped from a local high of $3,851 on July 21 to around $3,658, triggering speculation among traders that a local top may have formed. At the time of writing, ETH is down nearly 3% on the day with a trading volume of $442 billion.
On-chain data from Glassnode shows that profit-taking is visible around the $2,520 cost basis, indicated by the fading red band on the ETH Cost Basis Distribution Heatmap from July 1.
$ETH Cost Basis Distribution Heatmap shows profit-taking from buyers around $2,520 – visible in the fading red band from around July 1. But they still hold nearly 2M ETH. Takeaways: 1) strategic profit taking, 2) expecting more upside, 3) new demand is absorbing supply. pic.twitter.com/GPMONKKv2x
However, nearly 2 million ETH remains held by these addresses, suggesting confidence despite partial exits. Glassnode noted that additional upside is possible as new demand continues to absorb supply.
Santiment data further supports that whales are considering ETH as one of the best crypto to buy this bull season. Interestingly, while the number of Bitcoin whale wallets holding 1,000+ BTC dropped by 39 last week, Ethereum’s 10,000+ ETH wallets increased by 45 in the same period.
🐳 In the past week, crypto's top market caps are seeing whale numbers move in opposite directions:
📉 Bitcoin's 1K+ $BTC wallets DROP by 39 (-1.8%), price -3% 📈 Ethereum's 10K+ $ETH wallets RISE by 45 (+4.0%), price +25%
Additionally, data from Lookonchain confirms that fresh wallets are consistently buying Ether. For instance, wallet 0x8eEa received another 25,213 ETH (worth around $94.67 million) from FalconX earlier on July 22, with a total of 72,333 ETH accumulation in the past three days.
The trend aligns with significant institutional interest, as Ethereum spot ETFs recorded inflows of over 588,000 ETH last week. This is nearly 17 times the historical average and more than double the previous record inflow.
Last week, #Ethereum spot ETFs saw inflows of over 588K $ETH – nearly 17x the historical average and more than double the previous record. pic.twitter.com/FipYT0HrQZ
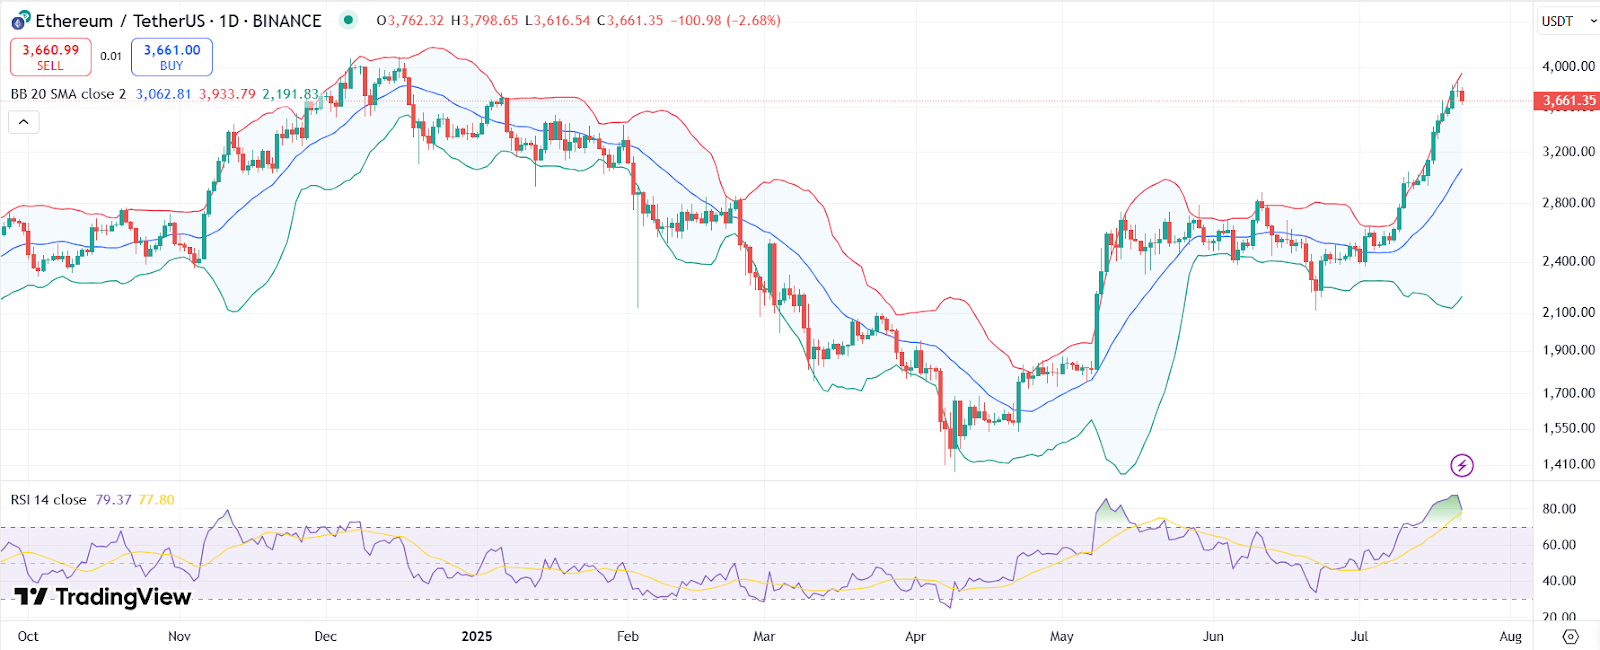
On the daily chart, ETH price is pulling back from the upper Bollinger Band after a strong upward move. This suggests a healthy cooldown within a bullish structure. The bands are still expanding, indicating continued volatility and potential upside.
ETH price chart with RSI and Bollinger Bands | Source: TradingView
The RSI stands in the overbought zone, suggesting that the second-largest cryptocurrency may consolidate or correct before the next leg up. Traders should keep an eye on the key resistance near $3,933. A breakout above this level could push ETH toward $4,200.
However, in case of downside pressure, ETH could see a drop to $3,300 with a deeper pullback leading to $3,000.
Disclaimer: Coinspeaker is committed to providing unbiased and transparent reporting. This article aims to deliver accurate and timely information but should not be taken as financial or investment advice. Since market conditions can change rapidly, we encourage you to verify information on your own and consult with a professional before making any decisions based on this content.
A crypto journalist with over 5 years of experience in the industry, Parth has worked with major media outlets in the crypto and finance world, gathering experience and expertise in the space after surviving bear and bull markets over the years. Parth is also an author of 4 self-published books.