Bitcoin Price Analysis: BTC/USD Trends of January 21–27, 2019
The strong bearish daily candle that broke down and closed below the $3,679 price level yesterday, followed by another bearish candle today implies that Bitcoin may find support at the previous low of $3,247.
By Azeez Mustapha
Updated
2 mins readPhoto: CafeCredit.com / Flickr
there is a probability for further declination of BTC price.
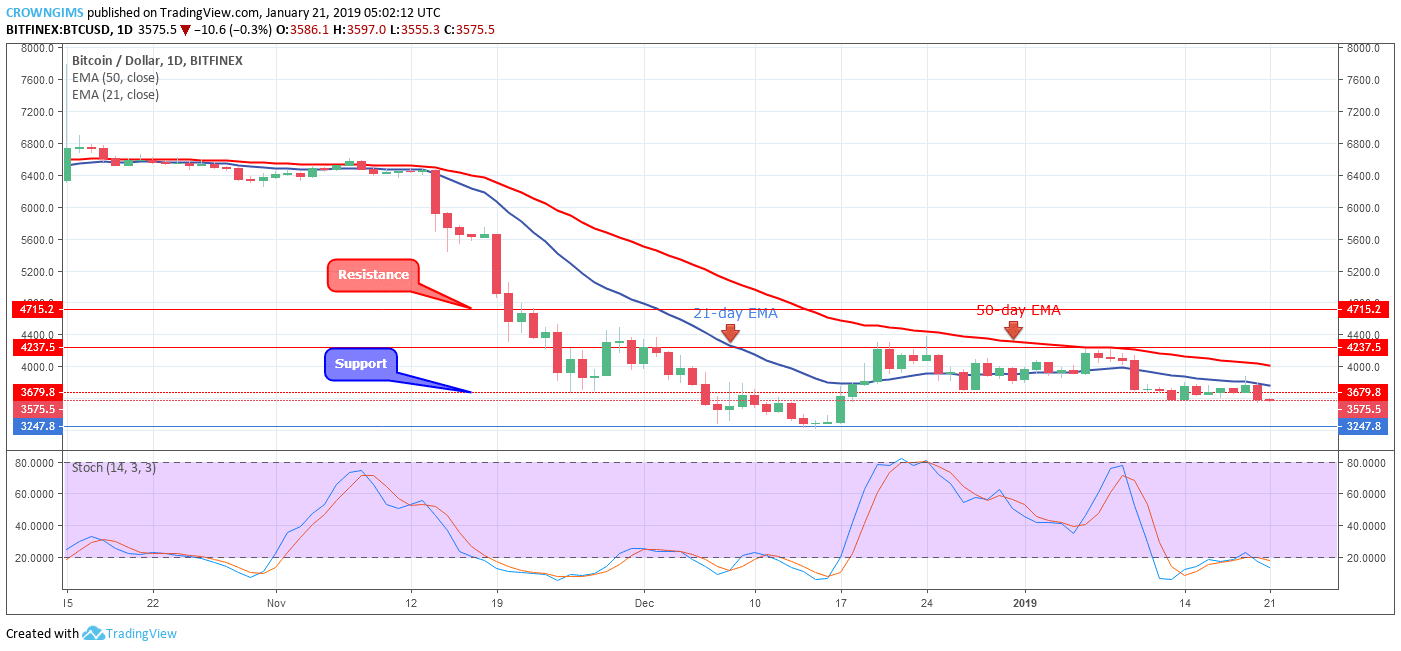
BTC/USD Long-term Trend: Ranging
Resistance levels: $3,679, $4,237, $4,715
Support levels: $3,247, $2,765, $1,956BTC/USD is on a ranging phase on the long-term outlook. Last week, Bitcoin price experienced another consolidation phase after slow bearish movement. The bears could not push down the coin further as expected. The low BTC price level of $3,247 could not be reached. The bulls as well lost the momentum and were unable to push up the Bitcoin price beyond last week price. The BTC price started consolidating on the $3,679 price level. The coin is currently facing the $3,247 price level.
The 50-day EMA remain above the 21-day EMA while the BTC price continues trading under the later which indicate that the bears were still holding to the BTC market. The Stochastic Oscillator period 14 is below 20 levels (at the oversold level) with its signal lines pointing down connotes further declination of BTC price and sell signal.
The strong bearish daily candle that broke down and closed below the $3,679 price level yesterday, followed by another bearish candle today implies that the coin may find support at the previous low of $3,247.
BTC/USD Medium-term Trend: Bearish
BTC/USD is bearish on the medium-term outlook. The bullish momentum pushed Bitcoin price from the $3,679 former support level towards the high of $4,237 price level last week before it was resisted from the further increase. The bears gained enough pressure and push the coin back to its previous low after broken down the barrier at $3,679 price level and that of dynamic support and resistance.
The coin is trading below the 21-day EMA and 50-day EMA with the two EMAs bending to the south as a sign of bears’ pressure. However, the stochastic Oscillator period 14 is below 20 levels (oversold level) twisted to each other and flat horizontally which indicates that the coin may experience consolidation for a short period of time.
Azeez Mustapha is a specialist in Computer Studies (including DTP), Forex and Crypto trading professional. Being expert technical and currency analyst, as well as experienced fund manager and author of several books, Azeez places strong focus on crypto market studies conducting comprehensive price analyses and sharing forecasts of presumptive market trends.

 BTC/USD is on a ranging phase on the long-term outlook. Last week, Bitcoin price experienced another consolidation phase after slow bearish movement. The bears could not push down the coin further as expected. The low BTC price level of $3,247 could not be reached. The bulls as well lost the momentum and were unable to push up the Bitcoin price beyond last week price. The BTC price started consolidating on the $3,679 price level. The coin is currently facing the $3,247 price level.
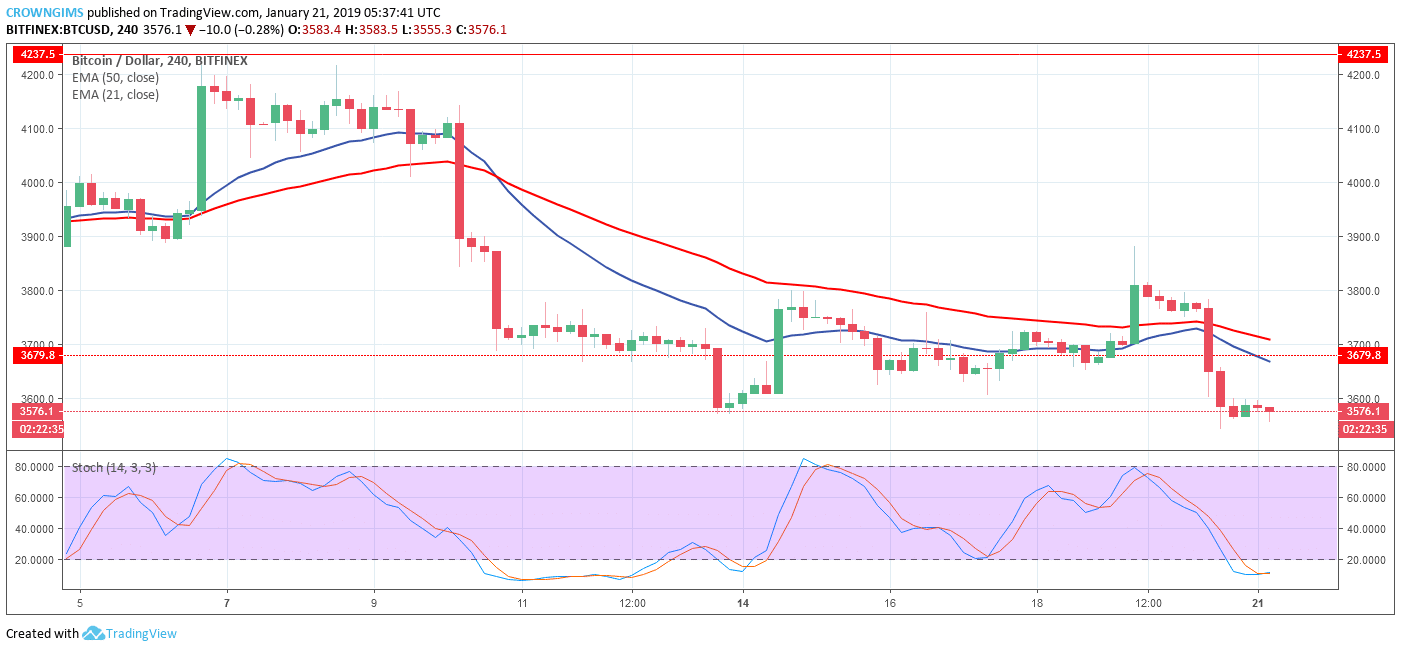 BTC/USD is bearish on the medium-term outlook. The bullish momentum pushed Bitcoin price from the $3,679 former support level towards the high of $4,237 price level last week before it was resisted from the further increase. The bears gained enough pressure and push the coin back to its previous low after broken down the barrier at $3,679 price level and that of dynamic support and resistance.


