Bitcoin Price Analysis: BTC/USD Trends of January 28–February 03, 2019
Should the bearish pressure increases, Bitcoin price will find its previous low of $3,247 and in case the bulls defend the previous low level and the BTC price bounces the bulls may take over the market.
there is a probability for further declination of BTC price.
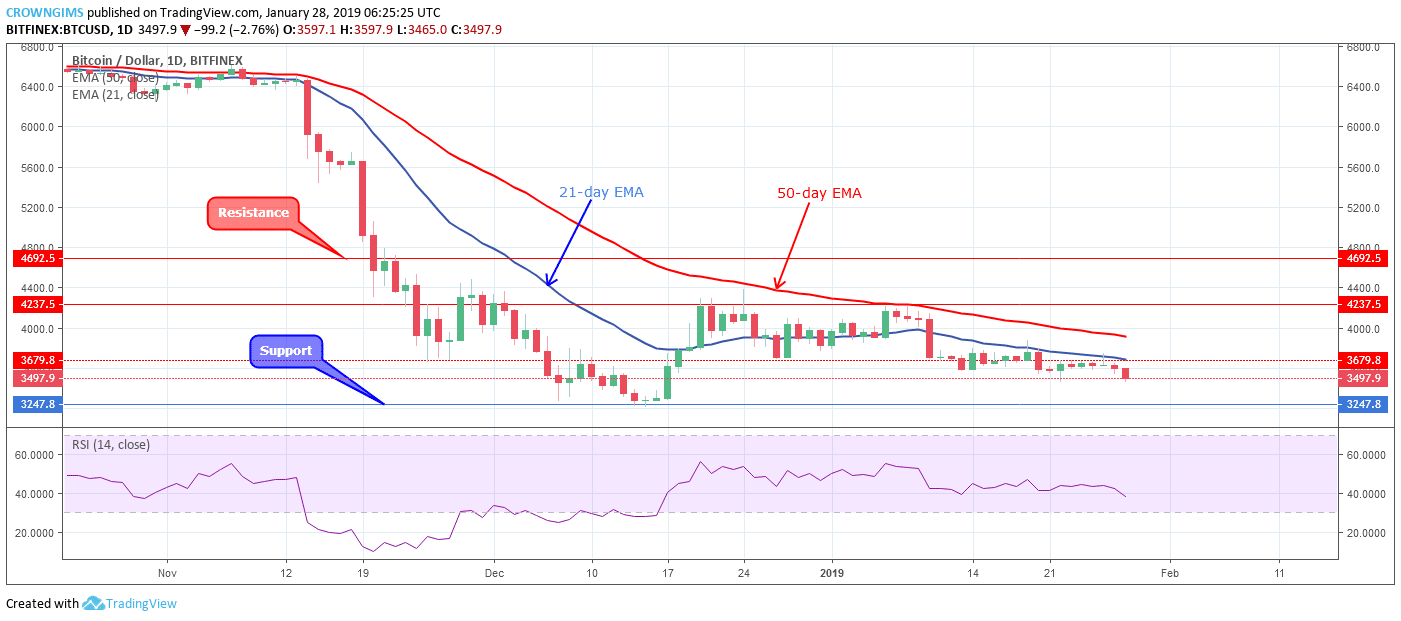
BTC/USD Long-term Trend: Ranging
Resistance levels: $3,679, $4,237, $4,692
Support levels: $3,247, $2,765, $1,956
BTC/USD continues in a ranging phase on the long-term outlook. The strong bearish daily candle that broke down and closed below the $3,679 price level on January 20, followed by another bearish candle turned to doji candle prevented Bitcoin price to find support at the previous low of $3,247 and the coin continues consolidating around the $3,679 price level. The bears’ pressure was weak and the bulls also had low momentum and the coin could not rally.
The BTC price remains under the 21-day EMA and 50-day EMA is still above the 21-day EMA implies that the cryptos is bearish but ranging on a spot in the BTC market. The Relative Strength period 14 is below 40 levels with its signal lines pointing down connotes sell signal.
Another strong bearish daily candle is emerging is an indication that Bitcoin price will still decline. Should the bearish pressure increases, the BTC price will find its previous low of $3,247 and in case the bulls defend the previous low level and the BTC price bounces the bulls may take over the market.
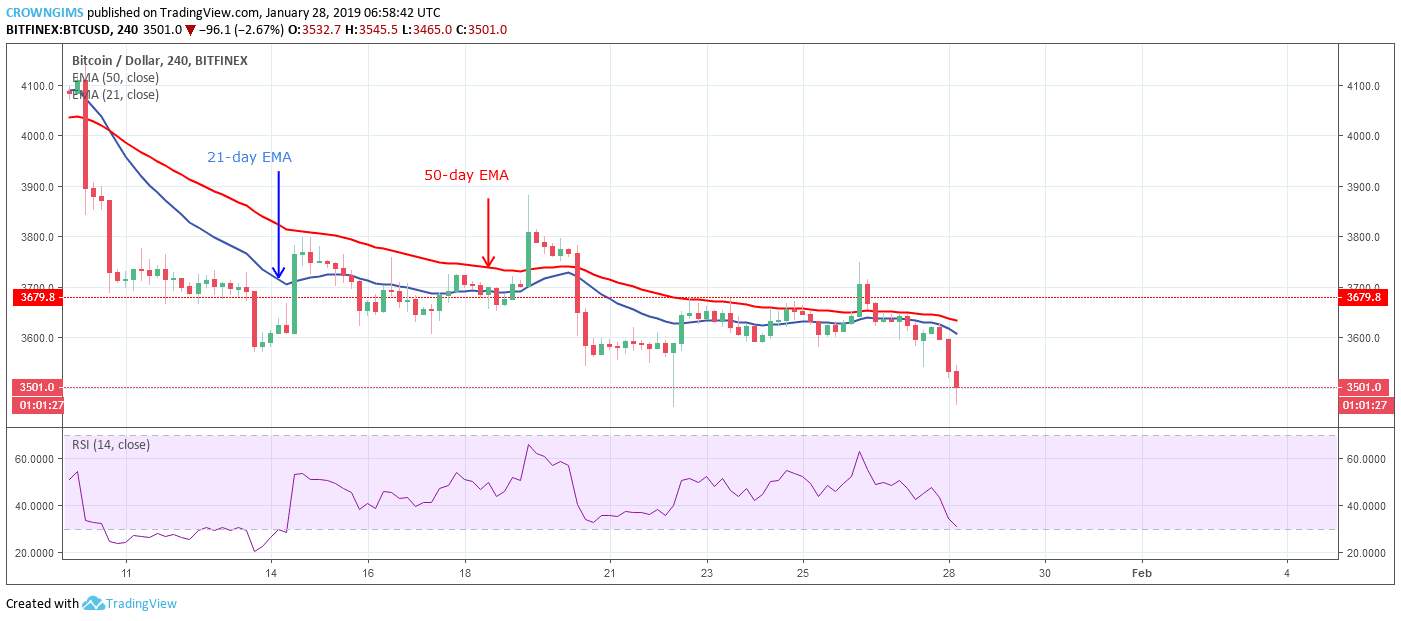
BTC/USD Medium-term Trend: Bearish
BTC/USD maintains a bearish trend on the medium-term outlook. On January 26 the bulls gathered momentum and pushed the BTC price to break up the $3,679 price level, not quite long the bulls lost the momentum and the bears took over the market, broke down the dynamic support and resistance and returned Bitcoin price back to declination level towards $3,247 demand level.
The Relative Strength Index is at 20 levels with its signal line pointing down connotes sell signal. BTC price is moving farther away from the two EMAs but still trading below the 21-day EMA and 50-day EMA with the two EMAs bending to the south as a sign of increased bears’ pressure.
Azeez Mustapha is a specialist in Computer Studies (including DTP), Forex and Crypto trading professional. Being expert technical and currency analyst, as well as experienced fund manager and author of several books, Azeez places strong focus on crypto market studies conducting comprehensive price analyses and sharing forecasts of presumptive market trends.

 BTC/USD maintains a bearish trend on the medium-term outlook. On January 26 the bulls gathered momentum and pushed the BTC price to break up the $3,679 price level, not quite long the bulls lost the momentum and the bears took over the market, broke down the dynamic support and resistance and returned Bitcoin price back to declination level towards $3,247 demand level.


