Bitcoin SV Price Analysis: BSV/USD Trends of January 16–22, 2019
In case the support level of $73 holds the coin will break up the $80 resistance level and the bullish candle close above it, then it may have its target at $85 – $92, else further declination of Bitcoin SV price is certain.
By Azeez Mustapha
Updated
2 mins readPhoto: Shutterstock
Key Highlights:
The bears still hold tight to the Bitcoin SV market;
the Bulls may takeover in case there is break out at $80;
the downtrend may continue.
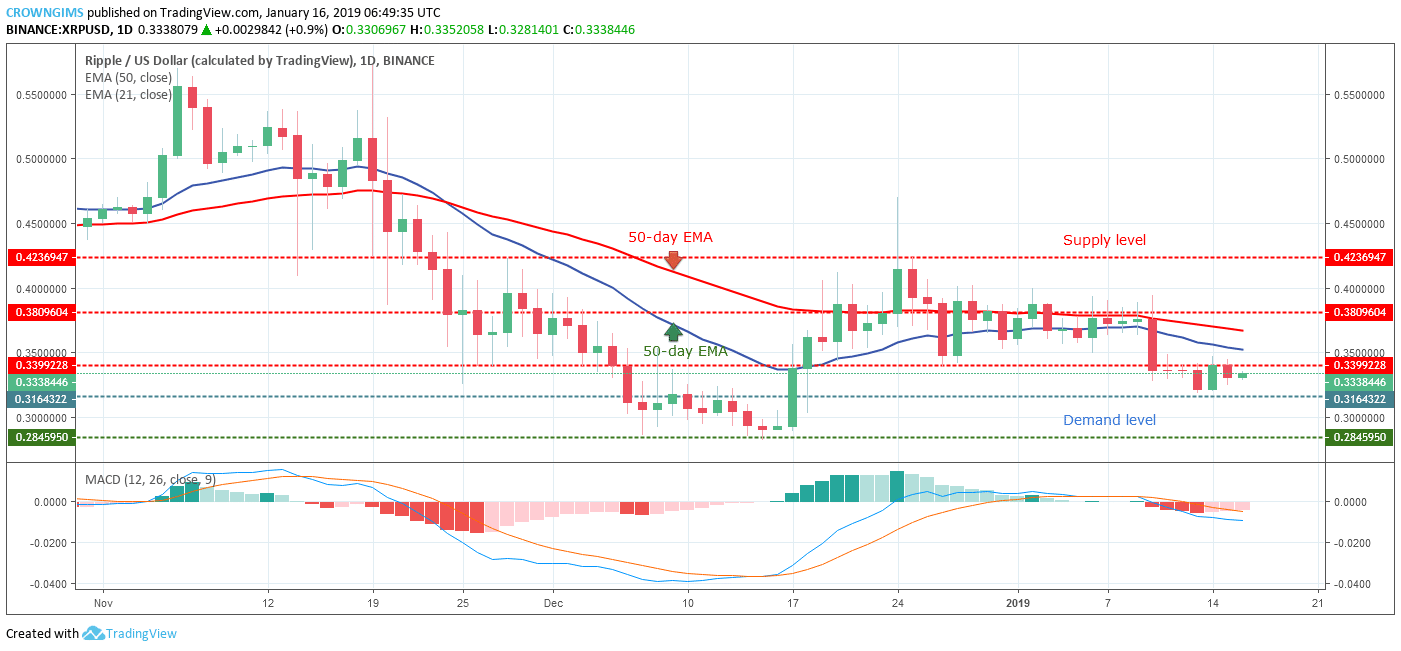
BSV/USD Price Medium-term Trend: Bearish
Resistance levels: $80, $85, $92
Support levels: $73, $68, $61On the medium –term, BSV/USD remain on bearish trend; BSV/USD price was in-between $92 and $85 price level last week, the bears were able to breakdown the support level of $85 with the full force, seen clearly on the chart as the massive strong bearish candle formed that penetrated the support level and closed below it followed by more bearish Japanese candle that later bottomed the Bitcoin SV price at $73 demand level on January 11.
The bulls interrupted the bearish trend and the BSV price was returned to previous high above $85 price level later the bearish inside bar candle pattern formed pushed the coin below the EMAs.
The 21-day EMA and 50-day EMA are well sloppy with the cryptocurrency below the two EMAs which symbolize bearish trend in the BSV market. The Stochastic Oscillator period 14 is at 20 levels sloppy down connotes sell signal. In case the support level of $73 holds the coin will break up the $80 resistance level and the bullish candle close above it, then it may have its target at $85 – $92.
BSV/USD Price Short-term Trend: Bearish
BSV/USD is still on the bearish trend on the short-term outlook. The fluctuation of the coin within the $92 and $85 price range was put to an end as the bears gathered momentum and broke down the $85, $80 support level and the price rolled down the market, found support at $73 price level. Bitcoin SV price later rallied to the north by the bulls’ intervention and it broke up the $80 price after which the bears returned it below $80 price level.
As at present, Bitcoin SV price is trading in-between the 21-day EMA and the 50-day EMA while the Stochastic Oscillator period 14 is above 60 levels with the signal lines pointing upward which indicates buy signal. It is only when the bulls would not penetrate the $80 price level we expect further declination of BSV price.
Azeez Mustapha is a specialist in Computer Studies (including DTP), Forex and Crypto trading professional. Being expert technical and currency analyst, as well as experienced fund manager and author of several books, Azeez places strong focus on crypto market studies conducting comprehensive price analyses and sharing forecasts of presumptive market trends.

 On the medium –term, BSV/USD remain on bearish trend; BSV/USD price was in-between $92 and $85 price level last week, the bears were able to breakdown the support level of $85 with the full force, seen clearly on the chart as the massive strong bearish candle formed that penetrated the support level and closed below it followed by more bearish Japanese candle that later bottomed the Bitcoin SV price at $73 demand level on January 11.
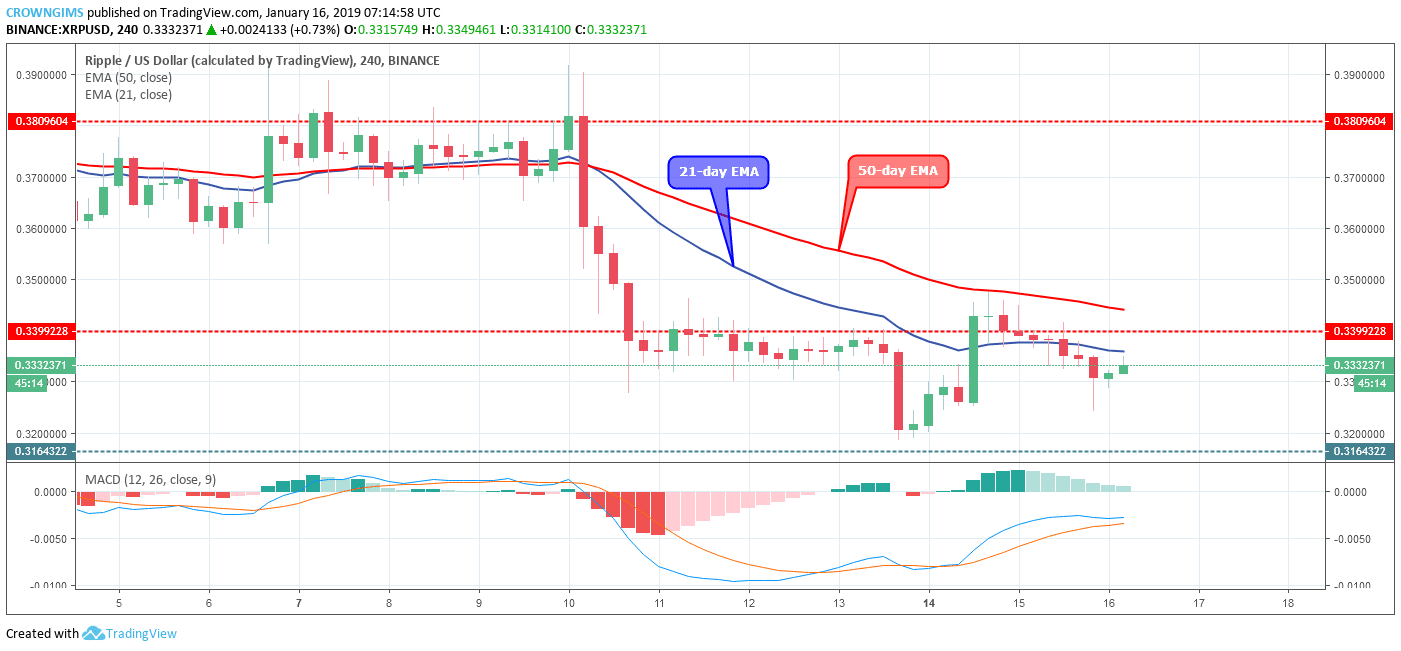 BSV/USD is still on the bearish trend on the short-term outlook. The fluctuation of the coin within the $92 and $85 price range was put to an end as the bears gathered momentum and broke down the $85, $80 support level and the price rolled down the market, found support at $73 price level. Bitcoin SV price later rallied to the north by the bulls’ intervention and it broke up the $80 price after which the bears returned it below $80 price level.