Bitcoin SV Price Analysis: BSV/USD Trends of December 12–18
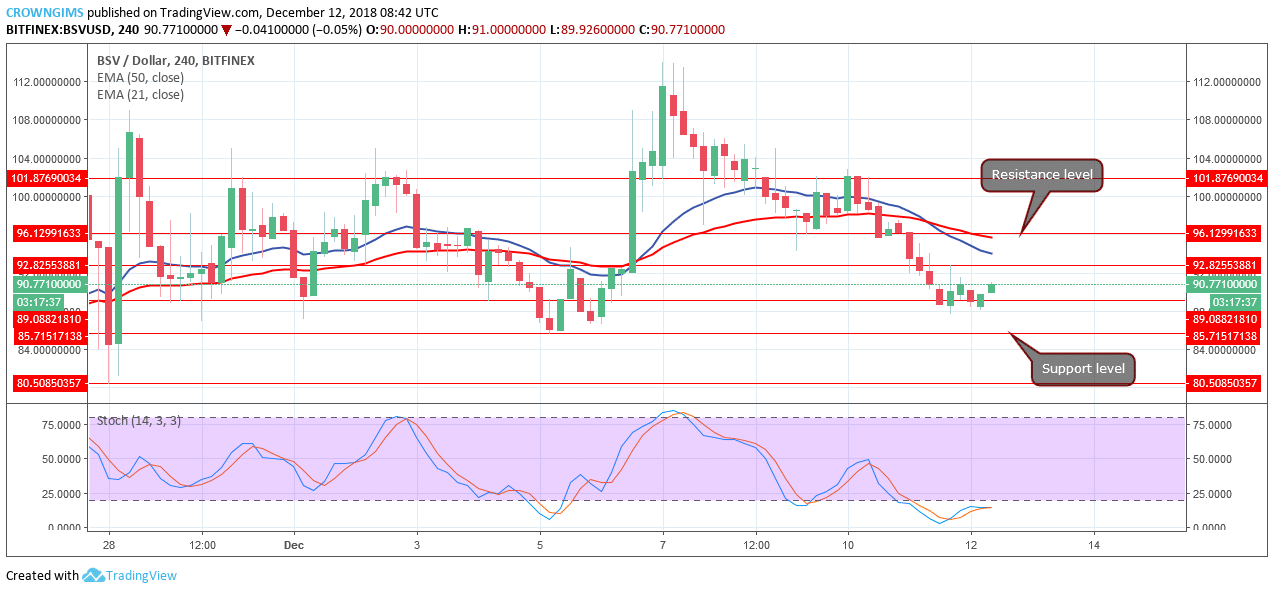
“Double bottom” pattern was formed as it is clearly seen on the chart which indicates that BSV price may hit $92 price level in which if the level is broken the coin may have its high at $96 price level.
By Azeez Mustapha
Updated
2 mins readPhoto: Bitcoin SV / Twitter
Resistance levels: $92, $96, $101
Support levels: $89, $85, $80BSV/USD is on the bearish trend on the medium-term outlook. The cryptocurrency left the consolidation zone on December 10. It rallied down and broke the former demand levels of $96, $92. Yesterday, the coin reached the demand level of $89. The 21-day EMA has crossed 50-day EMA indicating bearish momentum on the Bitcoin SV market. On December 7, an attempt to break the resistance level of $92 failed as the upward movement was rejected.
BSV price is currently consolidating on the support level of $89, below the 21-day EMA and 50-day EMA with a distance away from each other indicating the bearish trend is ongoing. The Stochastic Oscillator period 14 is at the oversold region (below 25 levels) with signal lines interlocked as a sign of consolidation. It equally indicates that Bitcoin SV has strong bearish momentum and sell signal.
In case the bears break the demand level of $89 downside, the crypto will find support at the previous low of $85 – $80. An uptrend will be anticipated in case the $89 price level holds.
BSV/USD Price Short-term Trend: Bearish
BSV/USD is bearish on the short-term outlook. Bitcoin SV continues falling after confirmation of takeover at $101 resistance level on December 10. BSV closed lower at $89 support level after broken the former support levels of $96, $92.
“Double bottom” pattern was formed as it is clearly seen on the chart which indicates that BSV price may hit $92 price level in which if the level is broken the coin may have its high at $96 price level. In case the bears defend $96 price level, the coin will bounce and resume its bearish trend.
Meanwhile, the Stochastic Oscillator period 14 is above 40 levels with signal lines points upward which indicates buy signal.
Azeez Mustapha is a specialist in Computer Studies (including DTP), Forex and Crypto trading professional. Being expert technical and currency analyst, as well as experienced fund manager and author of several books, Azeez places strong focus on crypto market studies conducting comprehensive price analyses and sharing forecasts of presumptive market trends.

 BSV/USD is on the bearish trend on the medium-term outlook. The cryptocurrency left the consolidation zone on December 10. It rallied down and broke the former demand levels of $96, $92. Yesterday, the coin reached the demand level of $89. The 21-day EMA has crossed 50-day EMA indicating bearish momentum on the Bitcoin SV market. On December 7, an attempt to break the resistance level of $92 failed as the upward movement was rejected.
 BSV/USD is bearish on the short-term outlook. Bitcoin SV continues falling after confirmation of takeover at $101 resistance level on December 10. BSV closed lower at $89 support level after broken the former support levels of $96, $92.