Bitcoin SV Price Analysis: BSV/USD Trends of February 20–26, 2019
The strong bullish momentum is required to break the confluence that is preventing the Bitcoin SV from a bullish rally in the market. In case there is a bullish breakout at the $68 resistance level the coin may have its target at $85 price level.
By Azeez Mustapha
Updated
2 mins readPhoto: Shutterstock
Key Highlights:
There was a bullish breakout on Medium-term chart;
sideways movement confirmed in the Bitcoin SV market on the daily chart;
the downtrend may continue in case the $68 supply level holds.
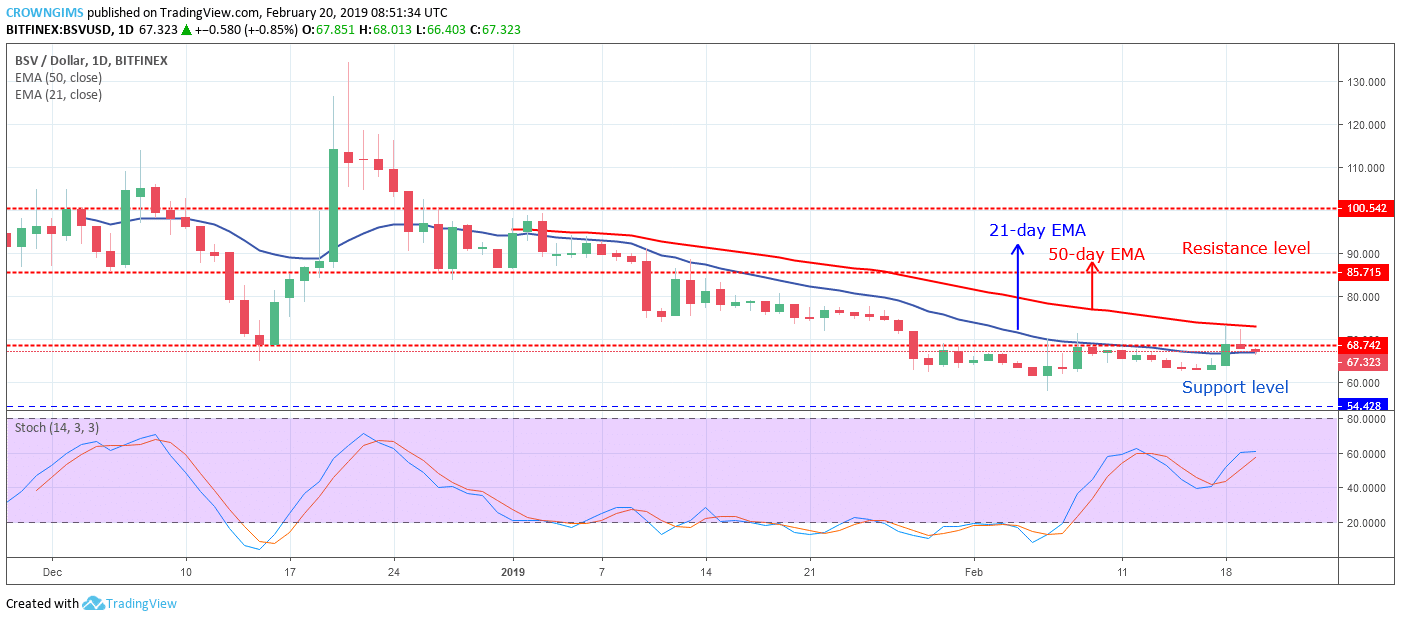
BSV/USD Price Long-term Trend: Ranging
Resistance levels: $68, $85, $100
Support levels: $54, $41, $30The ranging movement continues in Bitcoin SV/USD market on the Long –term. The momentum of both the bears and the Bulls remain at equilibrium in the Bitcoin SV market and price continues the ranging movement within $68 resistant level and $54 support level.
All attempt made by the bulls to break out from the consolidation zone proof abortive. A radical force is therefore required to make the coin rally. On February 18 the bullish candle emerged broken up the $68 price level but resisted at the dynamic resistance of 50-day EMA.
The Bitcoin SV is currently ranging in-between the 50-day EMA and the 21-day EMA. Certainly, the breakout is imminent. The stochastic Oscillator period 14 is at 60 levels with the signal lines bending towards south which indicates sell signal.
The strong bullish momentum is required to break the confluence that is preventing the Bitcoin SV from a bullish rally in the market. In case there is a bullish breakout at the $68 resistance level the coin may have its target at $85 price level. Alternatively, in case the $68 resistance level holds the coin will continue its ranging movement towards $54 price level.
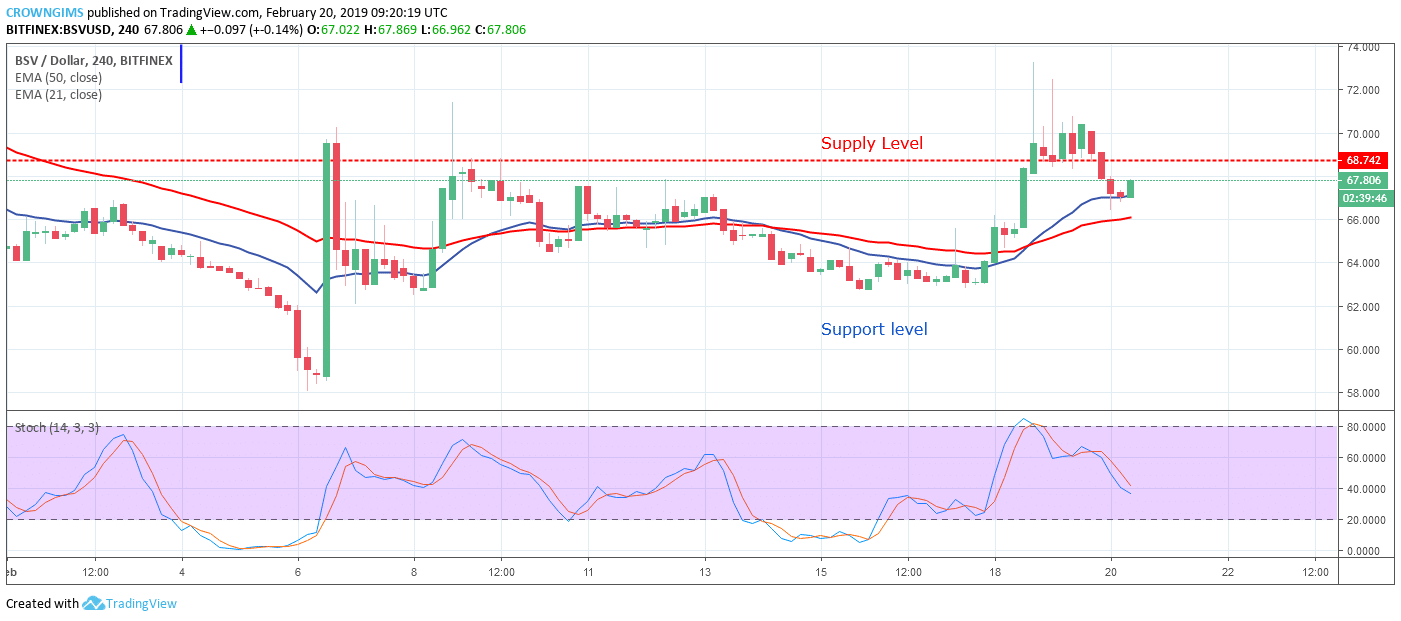
BSV/USD Price Medium-term Trend: Bullish
Bitcoin SV/USD is on the uptrend movement on the medium-term outlook. The cryptocurrency broke out of the consolidation phase on February 18 after many days of sideways movement within the range of $68 resistance level and $54 support level.
The bullish momentum triggered after the formation of a solid strong bullish candle, the Bitcoin SV inclined towards the $68 resistance level, penetrated the level upside, the bears interrupted the increase in the price of Bitcoin SV and the coin is currently retesting the broken level.
The Bitcoin SV is above the two EMAs and the 21-day EMA has crossed the50-day EMA upward as a confirmation for the uptrend. The Stochastic Oscillator is at 40-levels with signal lines pointing down which connotes sell signal.
Azeez Mustapha is a specialist in Computer Studies (including DTP), Forex and Crypto trading professional. Being expert technical and currency analyst, as well as experienced fund manager and author of several books, Azeez places strong focus on crypto market studies conducting comprehensive price analyses and sharing forecasts of presumptive market trends.

 The ranging movement continues in Bitcoin SV/USD market on the Long –term. The momentum of both the bears and the Bulls remain at equilibrium in the Bitcoin SV market and price continues the ranging movement within $68 resistant level and $54 support level.