Cardano (ADA) Price Analysis: Trends of September 28–October 4, 2018
Only a radical fundamental event can forcefully bring about a significant rally in the market on the daily chart.
By Azeez Mustapha
Updated
2 mins readPhoto: Shutterstock
Key Highlights:
There may be a break out of the consolidation this week;
more bullish candles are formed;
the price may retest the supply zone of $0.08 after the breakout
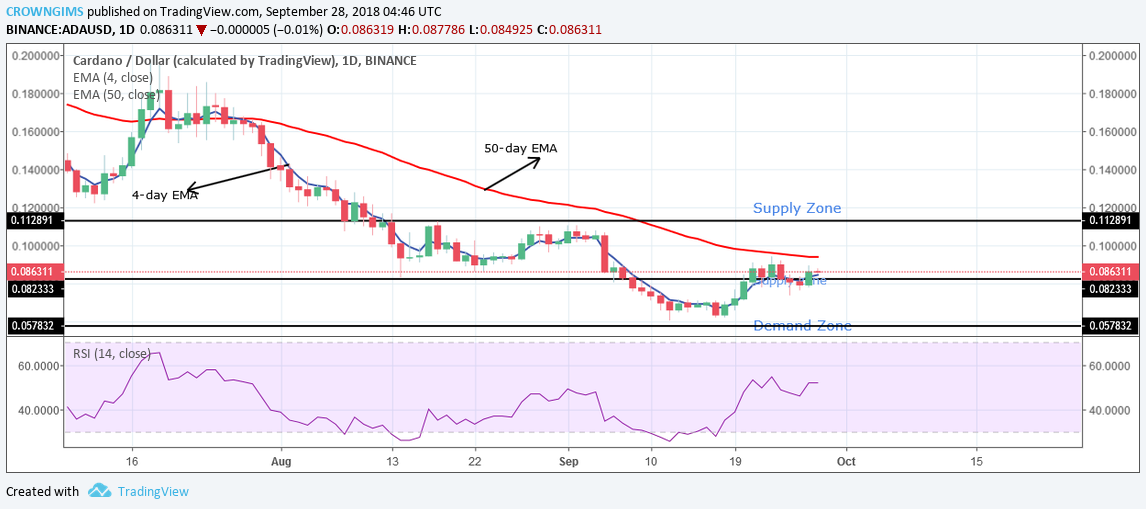
ADA/USD Price Long-term Trend: Ranging
Supply Zones: $0.08, $0.11, $0.13
Demand Zones: $0.05, $0.04, $0.03Cryptocurrency is ranging in its long-term outlook. The coin started ranging immediately the coin headed towards lower trend line and broke the last week strong demand Zone of $0.08 and continued its bearish movement in its long-term. The Bulls were able to push the price from the demand zone of $0.05 toward the dynamic resistance of 50-day EMA but could not break through and started consolidation at the region last week.
The price is currently between the 4-day EMA and the 50-day EMA at $0.08. Only a radical fundamental event can forcefully bring about a significant rally in the market on the daily chart. There is a probability that the price may break out this week of supply zone of $0.08, move upward towards the upper supply zone of $0.11 should the buyers increase their momentum. As the RSI 14 is at 50-levels pointing towards the north; there is a probability that the price will increase this week.
ADA/USD Medium-term Trend: Bullish
ADA/USD on the medium outlook is bullish. The price rallied towards the north after it had a rejection from the demand zone of $0.05 which ended up with the formation of the bullish candles on 4-H chart last week.
The price moved up and broke the supply zone of $0.08. The coin is currently above the 4-day EMA which has crossed the 50-day EMA upside. At present, the price is above the supply zone of $0.08 with the formation of more bullish candles.
The RSI 14 is above 70 levels with the signal line pointing upwards. There is a probability for the coin to retest the supply zone of $0.08 again before continues its uptrend movement. Should the supply zone of $0.11 broken, an uptrend movement will be triggered towards the upper supply zone of $0.13. Traders should patiently follow the trend.
Azeez Mustapha is a specialist in Computer Studies (including DTP), Forex and Crypto trading professional. Being expert technical and currency analyst, as well as experienced fund manager and author of several books, Azeez places strong focus on crypto market studies conducting comprehensive price analyses and sharing forecasts of presumptive market trends.

 Cryptocurrency is ranging in its long-term outlook. The coin started ranging immediately the coin headed towards lower trend line and broke the last week strong demand Zone of $0.08 and continued its bearish movement in its long-term. The Bulls were able to push the price from the demand zone of $0.05 toward the dynamic resistance of 50-day EMA but could not break through and started consolidation at the region last week.
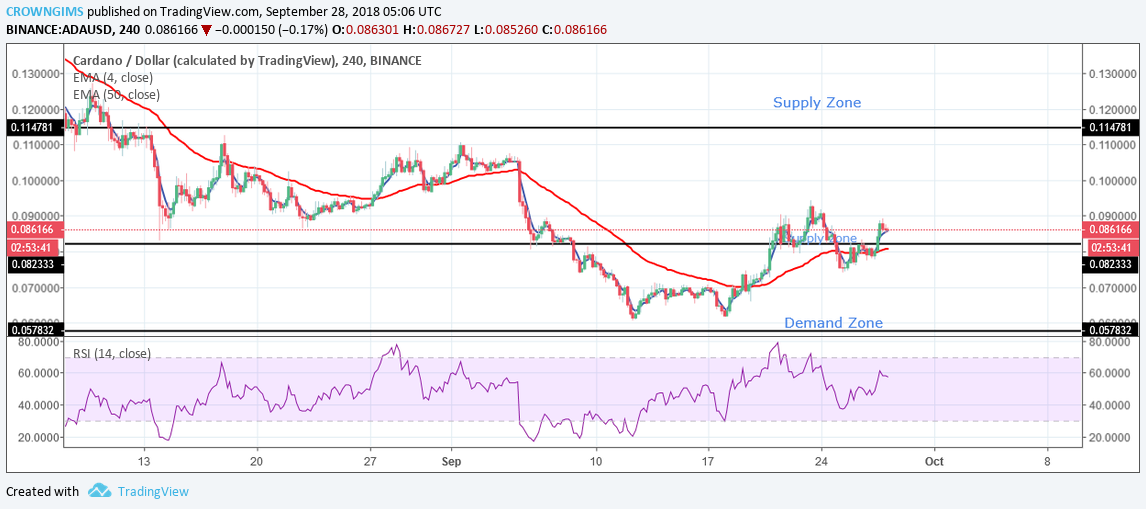 ADA/USD on the medium outlook is bullish. The price rallied towards the north after it had a rejection from the demand zone of $0.05 which ended up with the formation of the bullish candles on 4-H chart last week.