Cardano Price Analysis: ADA/USD Trends of November 23–29, 2018
There are possibilities for further downtrend movement in which Cardano price may have its low at $0.036 price level in case the bears break the demand zone of $0.042.
By Azeez Mustapha
Updated
2 mins readPhoto: QuoteInspector
the bulls may take over ADA market in case demand zone of $0.042holds;
bears were in control of ADA market.
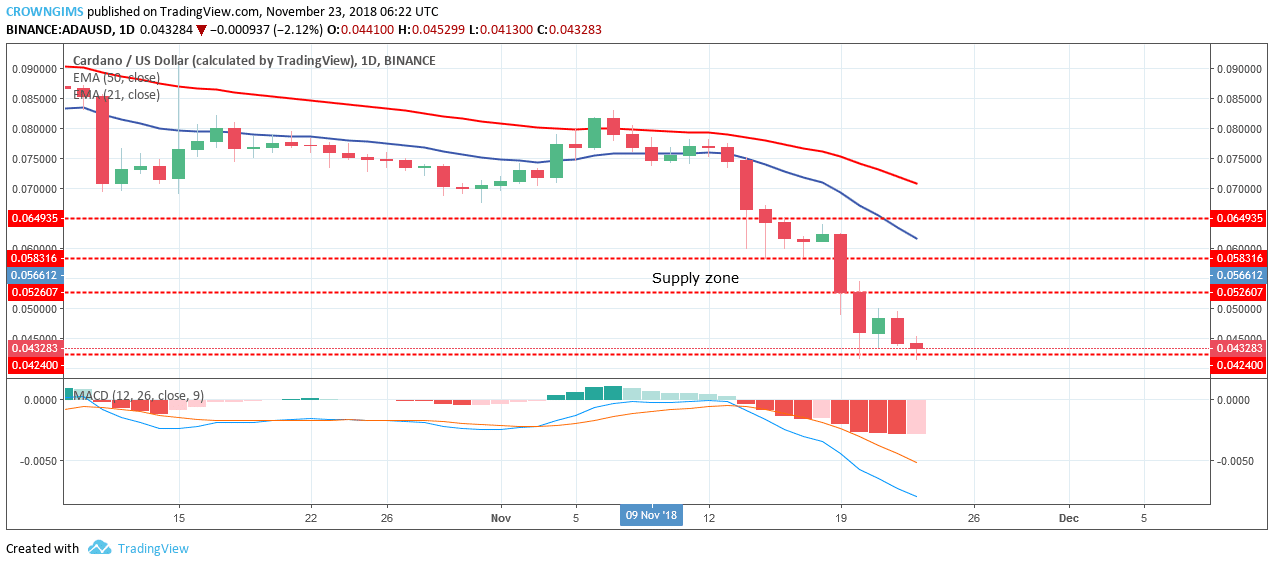
ADA/USD Price Long-term Trend: Bearish
Supply Zones: $0.052, $0.058, $0.064
Demand Zones: $0.042, $0.036, $0.035Cardano continues its bearish trend movement on the daily chart. The Bears hold tight to the control of the ADA market as more strong bearish candles were formed. Cardano price was moving to the south with increased bearish pressure as it was forecasted. It continues breaking downside the former demand zones of $0.064, $0.058, $0.052 and later found its low at the demand zone of $0.042.
The coin still continues trading below 21-day EMA and the 50-day EMA, with the two EMAs, fanned apart from each other which connotes the strong bearish pressure. The MACD with its histogram is below zero level and the signal lines pointing towards the south, which indicates that there are possibilities for further downtrend movement in which ADA price may have its low at $0.036 price level in case the bears break the demand zone of $0.042.
ADA/USD Price Medium-term Trend: Bearish
On the 4-H chart, Cardano is still in the bearish trend. On November 20, ADA price was pushed up by the bulls as the pin bar formed followed by the strong bullish Japanese candle but unable to break up the supply zone of $0.052 and the ADA price was returned to the demand zone of $0.042.
In case the demand zone of $0.042 holds the bulls may take over the ADA market and may have its target at the supply zone of $0.052. Meanwhile, Cardano price is below21-day EMA and 50-day EMA, the two EMAs well separated from one another which connotes that the downtrend is ongoing. The MACD with its histogram fading away gradually above zero levels with signal lines point down indicates a sell signal.
Azeez Mustapha is a specialist in Computer Studies (including DTP), Forex and Crypto trading professional. Being expert technical and currency analyst, as well as experienced fund manager and author of several books, Azeez places strong focus on crypto market studies conducting comprehensive price analyses and sharing forecasts of presumptive market trends.
 Cardano continues its bearish trend movement on the daily chart. The Bears hold tight to the control of the ADA market as more strong bearish candles were formed. Cardano price was moving to the south with increased bearish pressure as it was forecasted. It continues breaking downside the former demand zones of $0.064, $0.058, $0.052 and later found its low at the demand zone of $0.042.
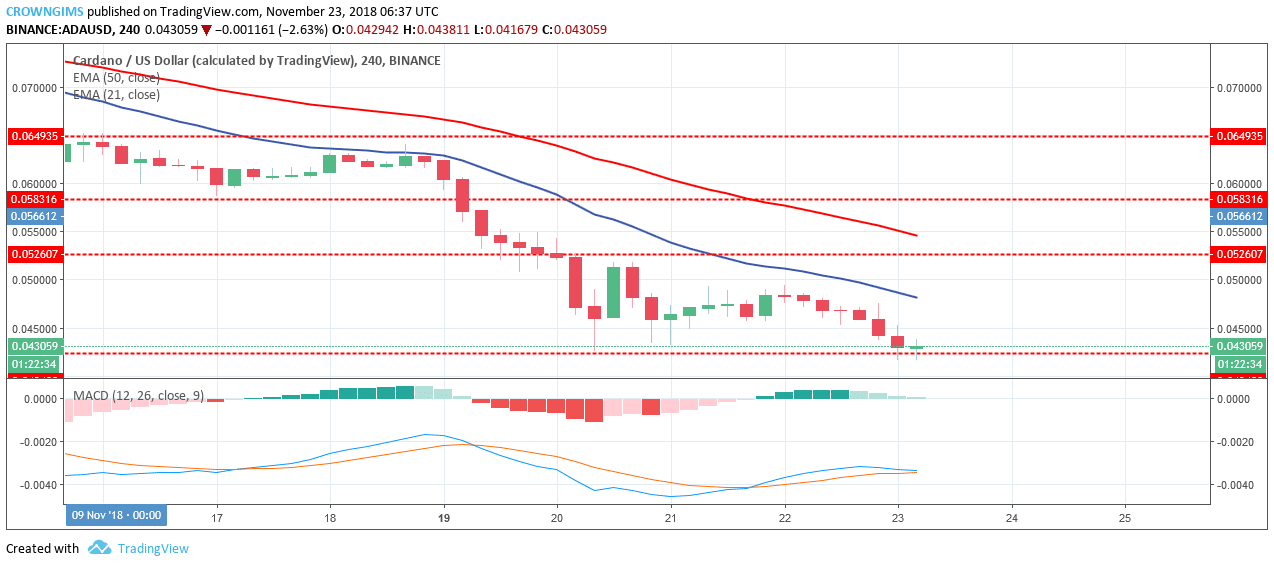 On the 4-H chart, Cardano is still in the bearish trend. On November 20, ADA price was pushed up by the bulls as the pin bar formed followed by the strong bullish Japanese candle but unable to break up the supply zone of $0.052 and the ADA price was returned to the demand zone of $0.042.