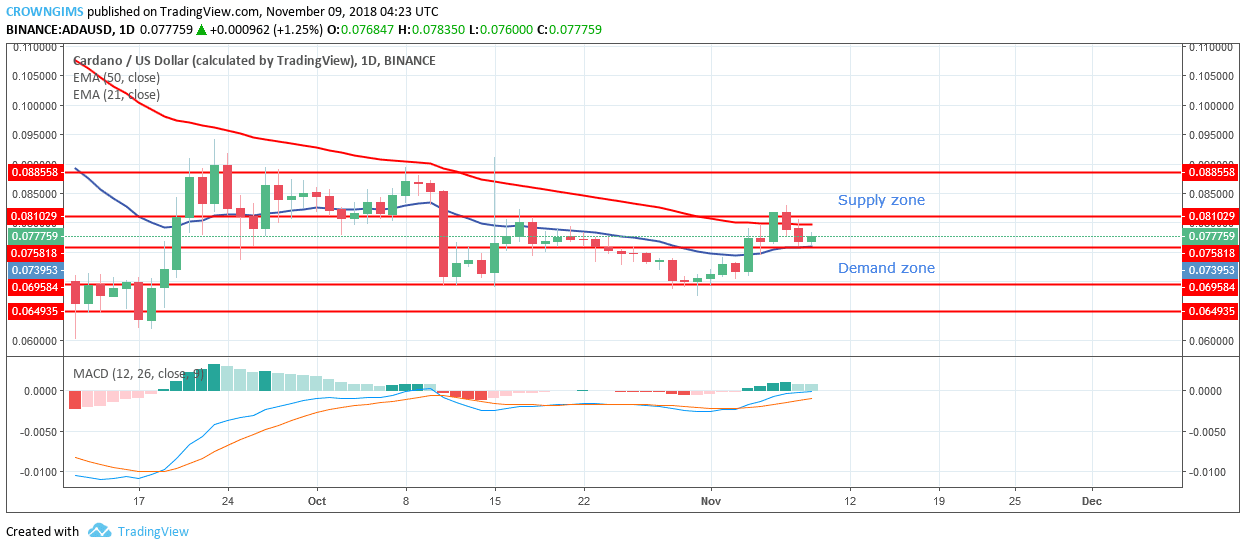
Supply Zones: $0.081, $0.088, $0.094
Demand Zones: $0.075, $0.069, $0.064Cardano is ranging on the long-term outlook. Last two weeks, ADA was in a bearish trend but could not break downside the demand zone of $0.069, that was the low reached on October 11. Last week, the coin was bullish within the range; the bullish pin bar formed at the demand zone of $0.069 signaled the return of the bulls that pushed the coin up to the supply zone of $0.081 but could not break up the zone that is the zone it reached on October 17. Cardano price has been ranging within the supply zone of $0.081 and the demand zone of $0.069 since October 7.
The coin remains on the ranging phase until the bulls break up the supply zone of $0.081 or the bears break down the demand zone of $0.069.
ADA price is between 21-day EMA and the 50-day EMA, while 50-day EMA is above the ADA price which indicates that ADA price is falling. Nevertheless, the MACD with its histogram is above zero level and the signal lines pointing towards the north which indicates that there are possibilities for upward movement if the bulls increase their momentum.
ADA/USD Price Medium-term Trend: Bullish
On the 4-H chart, Cardano is in the bullish trend. ADA price increased steadily last week as the pin bar formed on the dynamic resistance and support (21-day and 50-day EMA On October 31) which triggers the pressure of the bulls and ADA price was pushed up, broke up the former supply zone of $0.075 and $0.081 before it was interrupted by the bears. The bears pushed ADA price to the demand zone of $0.075.
Cardano price is between 21-day EMA and 50-day EMA, while 21-day EMA is above the price and the two EMAs are a distance from each other which indicates uptrend is ongoing.
The MACD with its histogram is below zero levels with signal lines point to the south, which indicates a sell signal.
In case the demand zone of $0.075 holds, ADA price will resume its uptrend movement which may break the supply zone of $0.081 upside, but in case the bulls lose the pressure the demand zone of $0.075will not hold and the demand zone of $0.069 will be exposed as the target.
Azeez Mustapha is a specialist in Computer Studies (including DTP), Forex and Crypto trading professional. Being expert technical and currency analyst, as well as experienced fund manager and author of several books, Azeez places strong focus on crypto market studies conducting comprehensive price analyses and sharing forecasts of presumptive market trends.

 Cardano is ranging on the long-term outlook. Last two weeks, ADA was in a bearish trend but could not break downside the demand zone of $0.069, that was the low reached on October 11. Last week, the coin was bullish within the range; the bullish pin bar formed at the demand zone of $0.069 signaled the return of the bulls that pushed the coin up to the supply zone of $0.081 but could not break up the zone that is the zone it reached on October 17. Cardano price has been ranging within the supply zone of $0.081 and the demand zone of $0.069 since October 7.
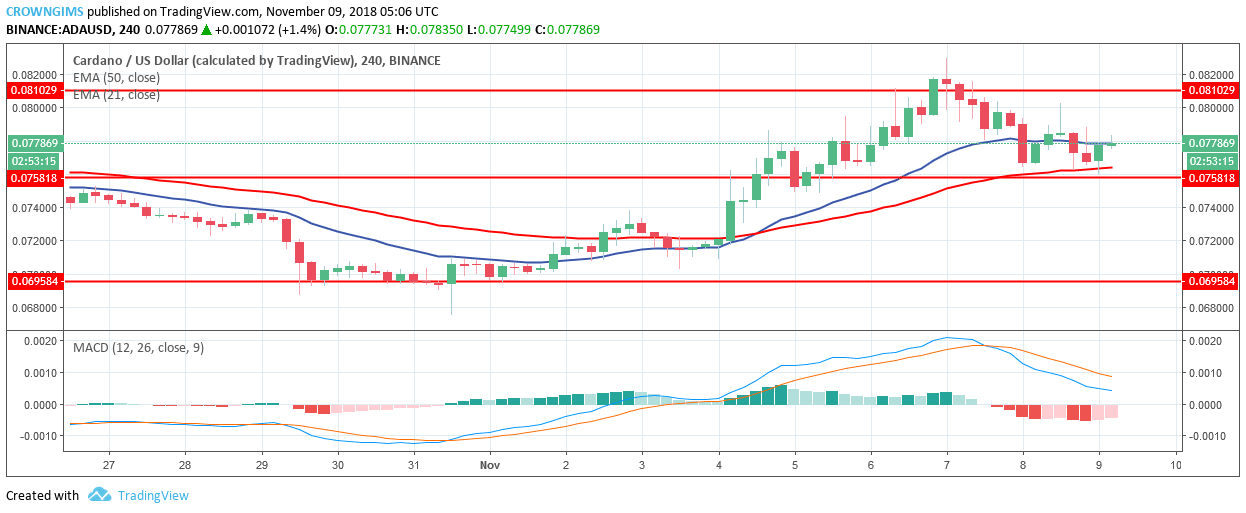 On the 4-H chart, Cardano is in the bullish trend. ADA price increased steadily last week as the pin bar formed on the dynamic resistance and support (21-day and 50-day EMA On October 31) which triggers the pressure of the bulls and ADA price was pushed up, broke up the former supply zone of $0.075 and $0.081 before it was interrupted by the bears. The bears pushed ADA price to the demand zone of $0.075.