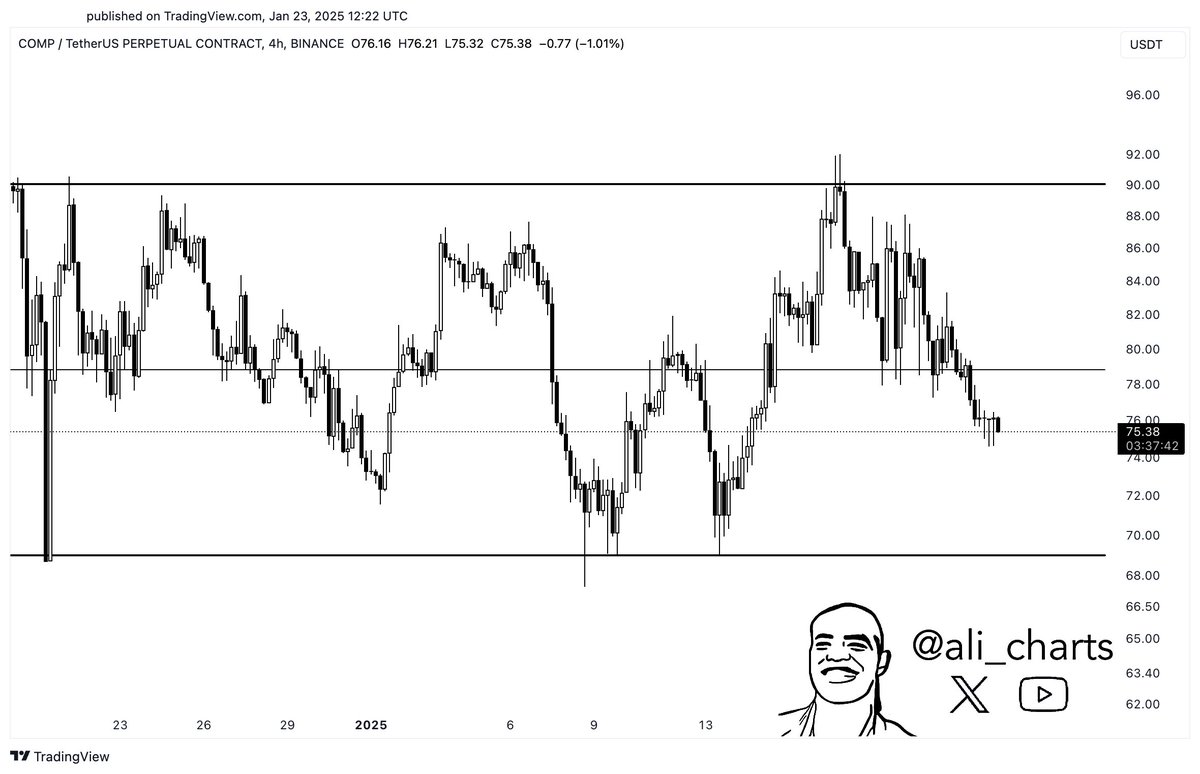
Ali Martinez highlighted that Compound (COMP) is trading in a parallel channel, forming lower highs and lower lows.
The prominent analyst predicted a decline of 11% to $69 for the COMP token.
COMP is trading at $77.89, surging a substantial 3.6% in the last 24 hours, claiming a market cap of $694.57 million.
COMP COMP$16.5724h volatility:3.9%Market cap:$160.23 MVol. 24h:$9.36 M
, the native token of leading digital asset lending protocol Compound, is at risk of a substantial crash, claims analyst Ali Martinez. The digital currently has soared 3.60% in the past day and is trading at a price tag of $77.89. However, in the last seven days, COMP bled a significant 13%, despite briefly reclaiming the $90 price level, a major resistance wall for the altcoin.
As per a post on social media platform X (formerly Twitter) by Martinez, COMP is consolidating in a parallel channel, a technical analysis pattern where the asset in question is trading back and forth between two price levels. The two parallel trendlines act as support and resistance levels for price movement. The channels can move upward, downward, or sideways, depending on the trend.
Martinez highlighted via the chart below that COMP is making lower highs and lower lows over time and predicted a target of $69, forecasting a decline of over 11%. Meanwhile, the digital asset opened today’s candle at $77.39, claiming a high of $78.78. The digital asset has crashed massively over the years, currently at a 91.42% discount to its all-time high of $911.20, seen over four years ago.
Source: Ali Martinez on X
Meanwhile, the data from DefiLlama shows that Compound Finance has a total value locked (TVL) of $2.961 billion, significantly down from the all-time high of $12.147. The protocol’s 30-day revenue stands at $308,500 while its revenue in the past day is $9,879. Additionally, CoinMarketCap data reveals that 97.56% of the wallets have $0-$1K invested in COMP while only 0.13% of wallets have more than $100K.
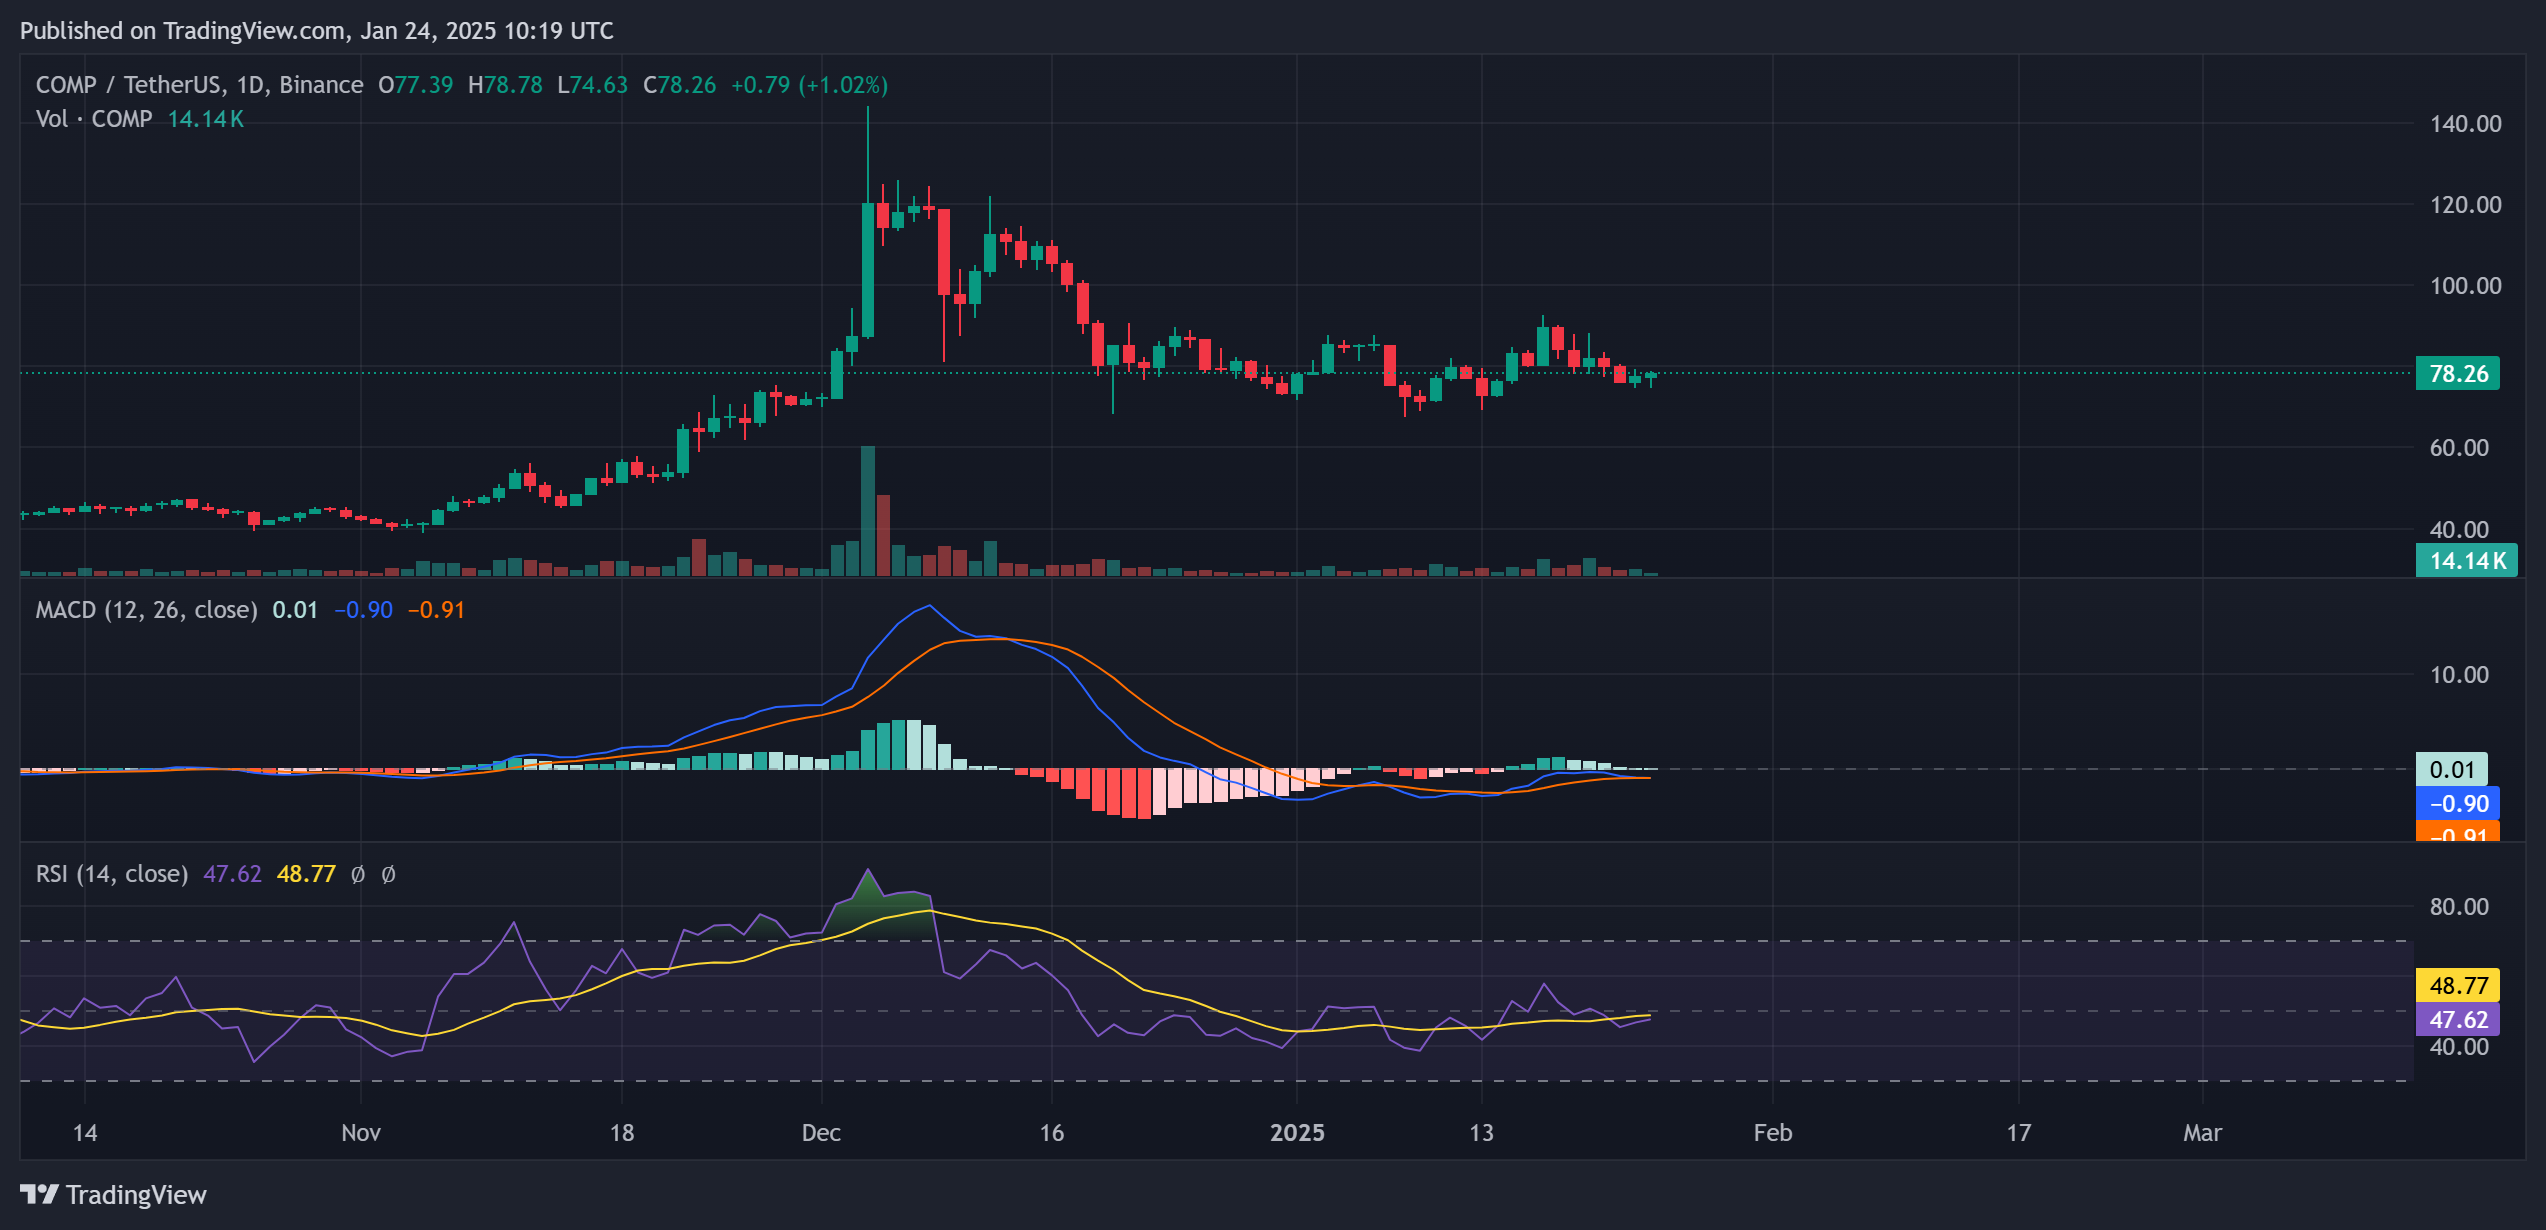
COMP Technical Analysis
As per the chart provided by TradingView below, the COMP price action is situated in the bearish region of the Relative Strength Index (RSI), which reads a value of 47.62. However, the gradient of the RSI line shows that bears are gaining strength as the trading volume of COMP soared 57.79% in the past 24 hours.
Source: TradingView
On the other hand, the Moving Average Convergence/Divergence (MACD) indicator shows that the MACD line and the signal line (red) are almost touching each other which basically means that a bearish divergence could be witnessed if COMP loses a $77 price level. The MACD histogram is also about to turn red, which aligns with Martinez’s bearish prediction for the Compound token.
Disclaimer: Coinspeaker is committed to providing unbiased and transparent reporting. This article aims to deliver accurate and timely information but should not be taken as financial or investment advice. Since market conditions can change rapidly, we encourage you to verify information on your own and consult with a professional before making any decisions based on this content.
A crypto journalist with over 5 years of experience in the industry, Parth has worked with major media outlets in the crypto and finance world, gathering experience and expertise in the space after surviving bear and bull markets over the years. Parth is also an author of 4 self-published books.