Crypto analyst Ali Martinez recently highlighted that DOGE is consolidating within a symmetrical triangle pattern, usually a prelude to explosive moves.
According to Martinez, Dogecoin is preparing for a 40% price move.
Looking at the 12-hour chart shared by Martinez, DOGE has been compressing inside a tightening triangle, bounded by lower highs and higher lows. Currently trading around $0.22, the coin sits just above the 0.5 Fibonacci retracement at $0.218.
A decisive breakout above the 0.618 Fib level at $0.233 could propel DOGE toward the $0.25–$0.28 zone, while a breakdown risks sending it back toward $0.188 support.
Martinez’s 40% projection implies a potential move toward $0.30–$0.32 if bulls win control, a level that coincides with key Fibonacci extensions.
Such a breakout would not only confirm bullish momentum but also bring DOGE closer to reclaiming the psychological $0.50 level, fueling long-term speculation about a run to $1.
ETF Hopes Add Fuel to the Fire
Meanwhile, prediction market platform Polymarket shows a 73% probability for a Dogecoin ETF approval, up 36% in recent weeks.
Short-Term Risks: Head & Shoulders on the 4H Chart
Not all analysts are convinced the path higher is straightforward. Market watcher Wise Crypto warns that Dogecoin’s 4-hour chart is flashing a Head & Shoulders pattern, a classic bearish signal.
🚨 Market looking too bleedy this week, $DOGE traders, stay cautious⚠️!
📊 On the 4hr time frame, a clear Head & Shoulder pattern has formed — a classic bearish setup. Right now price is testing the trend-line support zone
With price testing the neckline near $0.22, a confirmed breakdown could trigger a sharp correction toward $0.188 support.
Wise Crypto said that a short-term bounce is possible toward $0.25–$0.28, but the “risk is on the downside.” He advised investors to not rush entries.
DOGE Price Analysis: Signals Supportive but Cautious
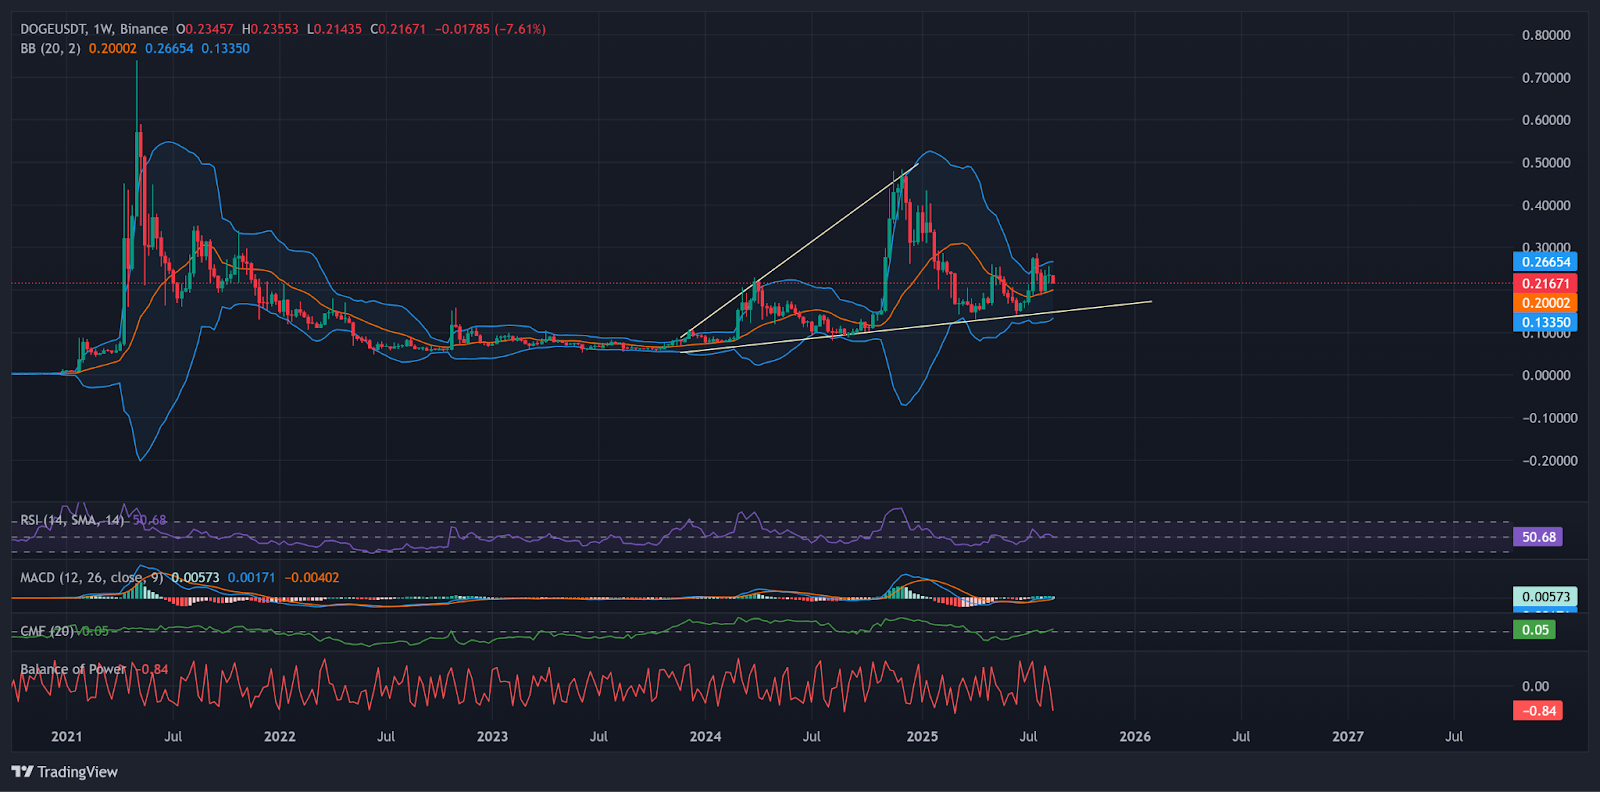
Looking at the weekly chart, DOGE seems to be forming a solid base above the ascending trendline that has been in place since early 2023.
The RSI (50.68) sits at neutral levels, leaving room for upside momentum while the MACD is hovering around the zero line, signaling a potential bullish crossover if momentum builds.
The Chaikin Money Flow (0.05) remains slightly positive, suggesting mild capital inflows while Bollinger Bands show DOGE compressing, a technical sign of a volatility squeeze before a large move.
DOGE weekly chart with momentum indicators. | Source: TradingView
The long-term trend remains intact as long as DOGE holds above $0.20, while a breakout above $0.28–$0.30 could validate the bullish scenario and open the door for a surge toward $0.40–$0.50.
The Road to $1: Dream or Reality?
Reaching $1 DOGE remains a psychological milestone and a meme-fueled dream for many traders, making it one of the best meme coins to buy.
To get there, Dogecoin would need both strong technical breakouts and a wave of fundamental catalysts, such as an ETF approval, renewed retail hype, or retail adoption.
Disclaimer: Coinspeaker is committed to providing unbiased and transparent reporting. This article aims to deliver accurate and timely information but should not be taken as financial or investment advice. Since market conditions can change rapidly, we encourage you to verify information on your own and consult with a professional before making any decisions based on this content.
A crypto journalist with over 5 years of experience in the industry, Parth has worked with major media outlets in the crypto and finance world, gathering experience and expertise in the space after surviving bear and bull markets over the years. Parth is also an author of 4 self-published books.