EOS Price Analysis: EOS/USD Trends of October 29-November 4, 2018
A bullish breakout will ensure that the resistance level at $6.0 is broken then the EOS price will rally to the level of $6.5 which is the upper resistance level of price.
By Azeez Mustapha
Updated
2 mins readPhoto: Shutterstock
Key Highlights:
Consolidation is ongoing;
the support level of $5.2 may be broken;
the resistance level of $6.0 may be broken.
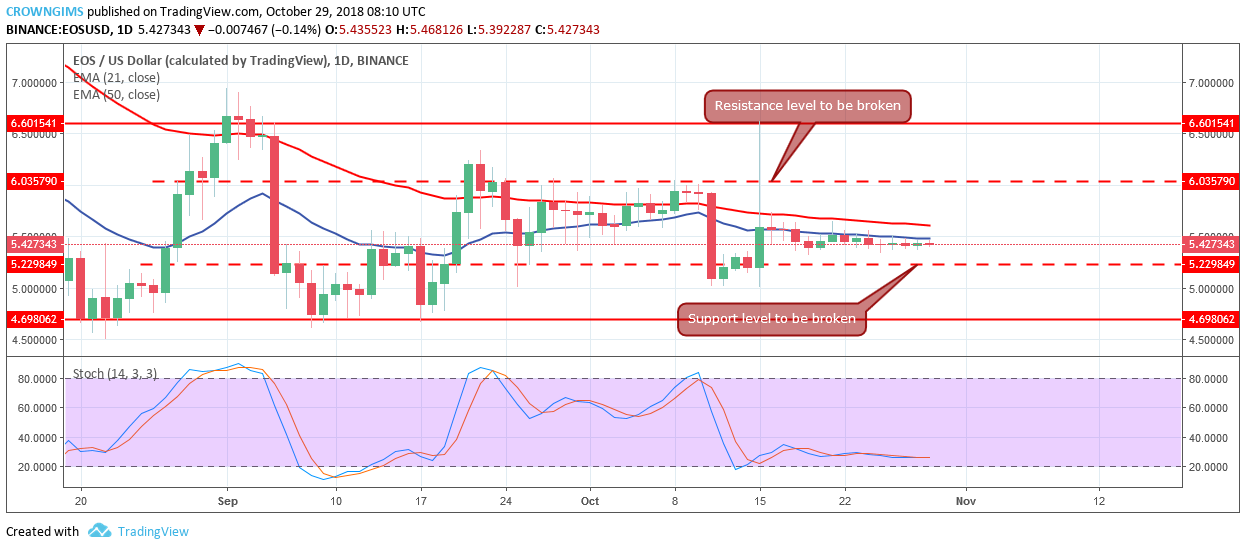
EOS/USD Price Long-term Trend: Ranging
Resistance levels: $6.0, $6.6, $7.3
Support levels: $5.2, $4.6, $4.0EOS continues its ranging movement in its long-term outlook. The EOS price is in a sideways trend after two weeks in a bearish trend. From the daily chart, indecisive Doji candlesticks are forming at a price of $5.4. It indicates that the supply and demand levels are said to be in equilibrium at $5.4. The coin has been trading within the price range of $6.0 resistance level and $5.2 support level. Presently, the price of EOS price is at the middle level of the price range.
If the bears break down the support level of $5.2, EOS price will sink to the lows of $4.6. However, on the upside, a bullish breakout will ensure that the resistance level at $6.0 is broken then the price will rally to the $6.5 price level which is the upper resistance level of price.
Trade recommendation may be unnecessary as the price is still consolidating. In addition, the Stochastic Oscillator period 14 is above 20 levels with the signal lines interlocked to each other which indicates that the price is in the sideways movement.
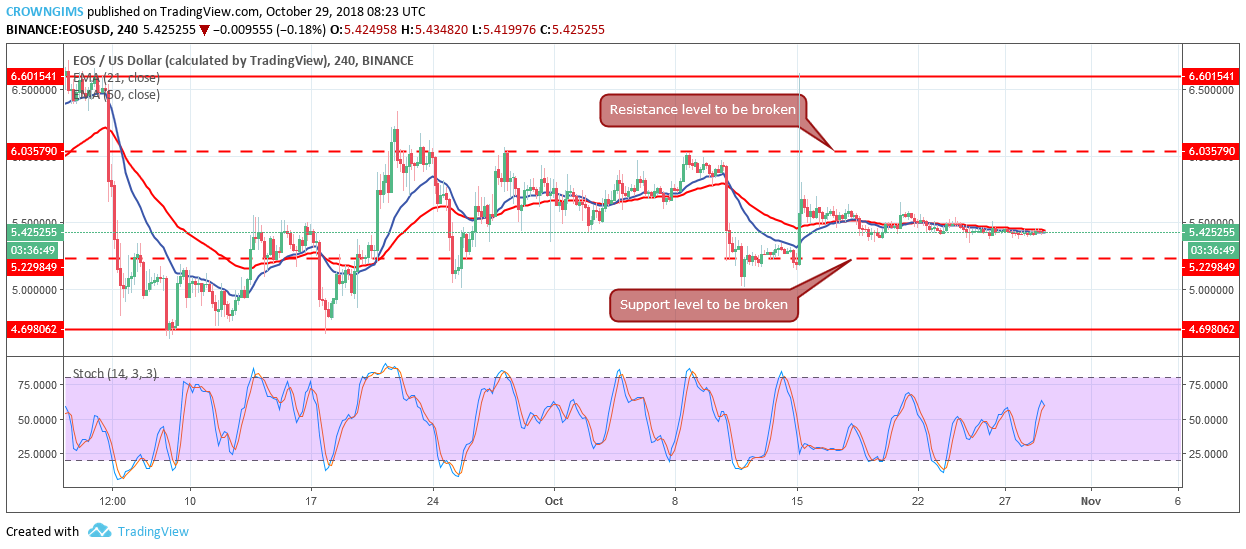
EOS/USD Price Medium-term Trend: Ranging
On the medium-term trend, the price of EOS is in a sideways trend. The cryptocurrency price and the two exponential moving averages (EMAs) are trending horizontally indicating a sideways trend. The EOS price is on the 21-day EMA and 50-day EMA indicating that the price is in the consolidation trend zone.
The bulls will have to increase their pressure before the price can rally to the north and break the resistance level of $6.0. Likewise, before the coin can reach and break the support level of $5.2 the bears have to increase their momentum. Nevertheless, the Stochastic Oscillator period 14 is above 50 levels with its signal lines pointing downward, which indicates the sell signal.
Azeez Mustapha is a specialist in Computer Studies (including DTP), Forex and Crypto trading professional. Being expert technical and currency analyst, as well as experienced fund manager and author of several books, Azeez places strong focus on crypto market studies conducting comprehensive price analyses and sharing forecasts of presumptive market trends.

 On the medium-term trend, the price of EOS is in a sideways trend. The cryptocurrency price and the two exponential moving averages (EMAs) are trending horizontally indicating a sideways trend. The EOS price is on the 21-day EMA and 50-day EMA indicating that the price is in the consolidation trend zone.