EOS/USD Price Analysis: Trends of September 17–23, 2018
The price is forming the last part of the “W” pattern which connotes the possibility of the price increases toward the resistance level of $6.8 and there is a possibility for a breakout.
Formation of “W” candles pattern confirmed on the daily and 4H chart;
the price might go up this week;
a break out at the resistance level of $6.8 is possible.
EOS/USD Long-term Trend: Bearish
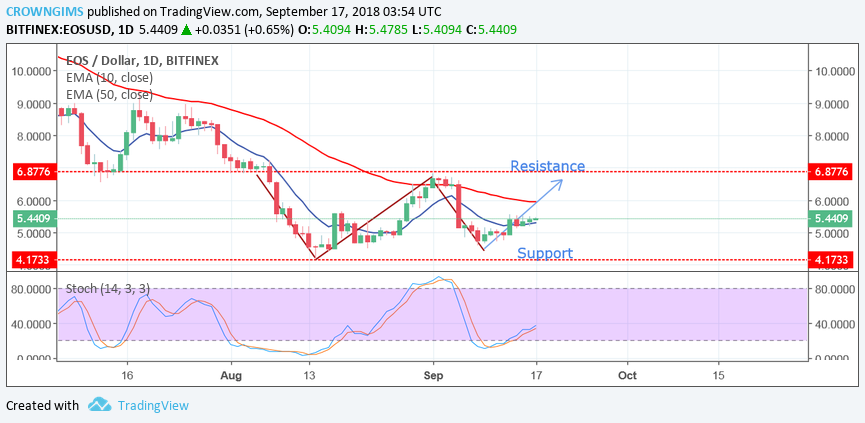
Resistance levels: $6.8, $9.4, $11.4
Support levels: $4.1, $2.0, $0.5The cryptocurrency has been making effort to break out of the channel it was since August 8, 2018. Another attempt was made last week to lower below the support level of $4.1 but closed higher towards the dynamic resistance level of 10-EMA with the formation of bullish candles. More pressure from the buyer pushed the price upward and was able to break the dynamic resistance 10-day EMA.
The price has kept ranging within the resistance level of $6.8 and support level of $4.1 on the daily charts for more than three weeks. If bulls hold on the current price range, the current market situation will persist. As at present the price forming the last part of the “W” pattern which connotes the possibility of the price increase this week towards the resistance level of $6.8.
The Stochastic Oscillator Period 14 on the daily chart is above the level 20, with its signal lines pointing upwards, which indicates the probability of a bullish movement this week.
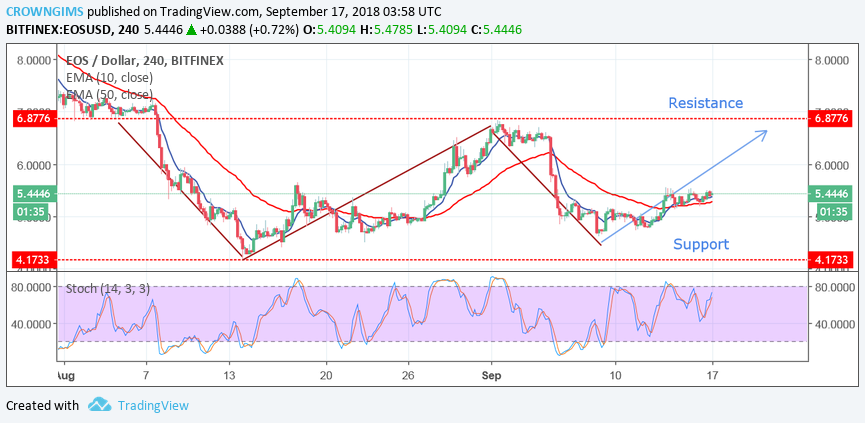
EOS/USD Price Medium-term Trend: Bullish
On the medium term, the price continues ranging within the boundaries of the resistance level at $6.8 and the support level at $4.1.The coin is bullish within the channel on the medium-term outlook. The price is currently moving upward with the formation of more bullish candles, which indicates that bears were losing control gradually as the current position of the Stochastic oscillator 14 suggests a temporal rise in momentum.
The 10-day EMA has crossed the 50-day EMA upward with the price above the 10-day EMA, confirming the uptrend. Should EOS price go up to the resistance level at $6.8 and produce a bullish candle pattern, then further upward movement could be anticipated. Traders should be patient for either a breakout at the upper resistance area or a breakdown at the lower support area before taking a position.
Azeez Mustapha is a specialist in Computer Studies (including DTP), Forex and Crypto trading professional. Being expert technical and currency analyst, as well as experienced fund manager and author of several books, Azeez places strong focus on crypto market studies conducting comprehensive price analyses and sharing forecasts of presumptive market trends.

 The cryptocurrency has been making effort to break out of the channel it was since August 8, 2018. Another attempt was made last week to lower below the support level of $4.1 but closed higher towards the dynamic resistance level of 10-EMA with the formation of bullish candles. More pressure from the buyer pushed the price upward and was able to break the dynamic resistance 10-day EMA.