Ethereum Price Analysis: ETH/USD Trends of November 20–26, 2018
In case the historical Ethereum price level of $140 hold, traders can initiate buy setups in anticipation for bullish trend.
By Azeez Mustapha
Updated
2 mins readPhoto: QuoteInspector
Key Highlights:
The bears were in control over the Ethereum market;
the downtrend may continue;
the ETH price may change to an uptrend.
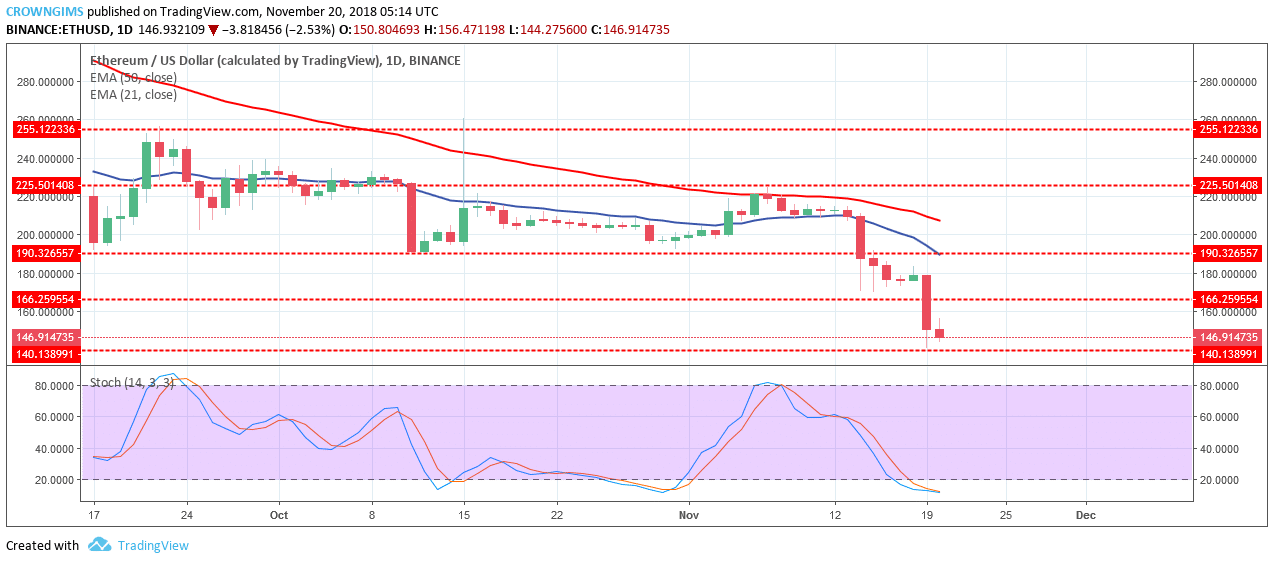
ETH/USD Long-term Trend: Bearish
Supply levels: $166, $190, $225
Demand levels: $140, $115, $102Ethereum is on a downtrend on the long-term outlook. The coin was consolidating upper week before the bears gained enough pressure last week and pushed the ETH price down the south. ETH broke downside the demand levels of $189, $186 as it was predicted last week and find its low at the historical price level of $140. ETH price was last seen at this level of $140 on November 16, 2017. The bears have been in control of the ETH market since last week.
This week Ethereum price may respect that historical price level. In other words, $140 price level may likely hold. In case of this level hold, traders can initiate buy setups in anticipation for bullish trend. ETH price is below the 21-day EMA and 50-day EMA with the two EMAs well separated; which indicates that the bearish trend is ongoing.
The Stochastic Oscillator period 14 is below 20 levels (oversold region) which indicate the preparation of the bulls to take over the market and change to an uptrend.
ETH/USD Medium-term Trend: Bearish
ETH/USD is on bearish trend on the 4-Hour chart. The bears were able to move the Ethereum price away from the ranging zone. Many bearish Japanese candles were formed which broke downside the last week demand zones and the ETH price was headed down to a previous low of $140 price level.
The ETH price is under 21-day EMA and 50-day EMA with the Stochastic Oscillator period 14 below 20 levels with the signal lines point to the south indicate a sell signal at the oversold zone. In case the demand level of $140 is broken by the bears, ETH will target the demand level of $115.
Azeez Mustapha is a specialist in Computer Studies (including DTP), Forex and Crypto trading professional. Being expert technical and currency analyst, as well as experienced fund manager and author of several books, Azeez places strong focus on crypto market studies conducting comprehensive price analyses and sharing forecasts of presumptive market trends.

 Ethereum is on a downtrend on the long-term outlook. The coin was consolidating upper week before the bears gained enough pressure last week and pushed the ETH price down the south. ETH broke downside the demand levels of $189, $186 as it was predicted last week and find its low at the historical price level of $140. ETH price was last seen at this level of $140 on November 16, 2017. The bears have been in control of the ETH market since last week.
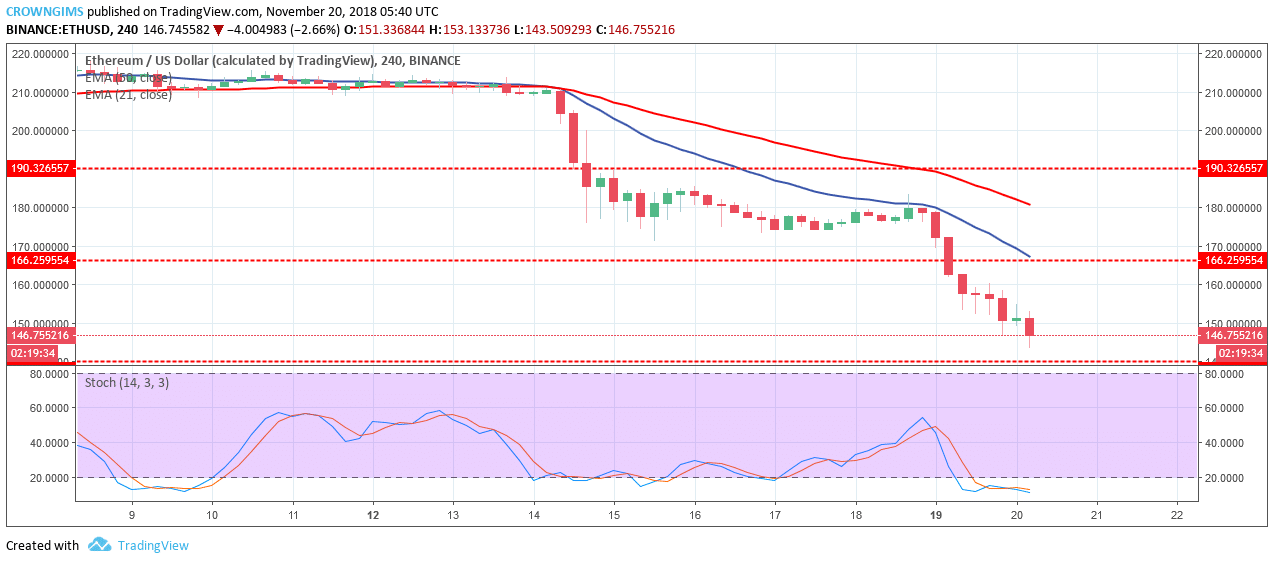 ETH/USD is on bearish trend on the 4-Hour chart. The bears were able to move the Ethereum price away from the ranging zone. Many bearish Japanese candles were formed which broke downside the last week demand zones and the ETH price was headed down to a previous low of $140 price level.