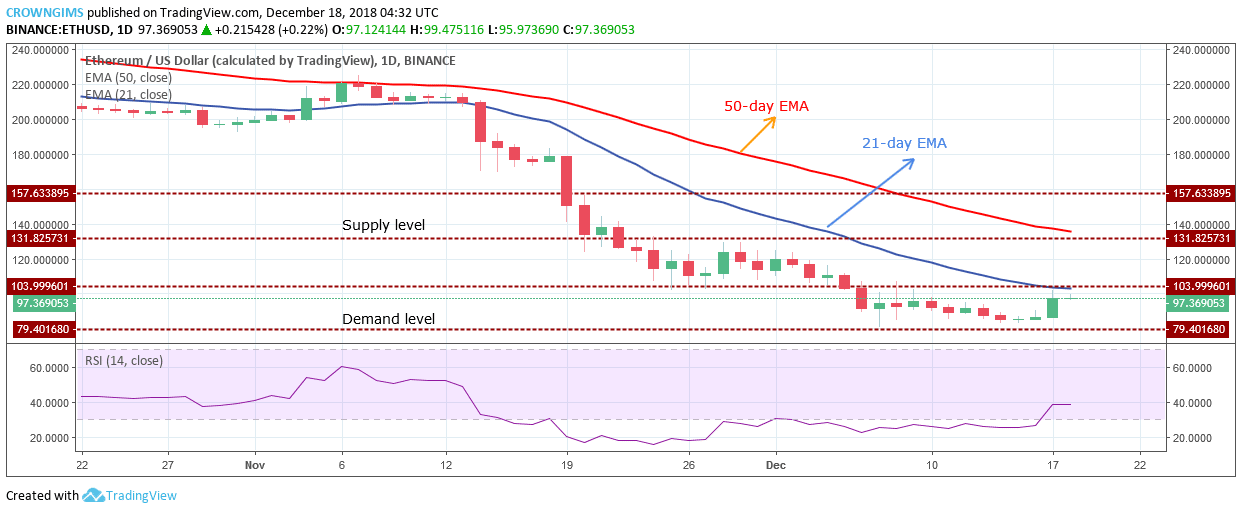
ETH price may target $131 price level as its high;
the bearish trend may continue in the ETH market.
ETH/USD Long-term Trend: Bearish
Supply levels: $103, $131, $157
Demand levels: $79, $60, $47ETH remains in its bearish trend on the long-term outlook. The bears still hold tight to the Ethereum market without giving space to the bulls. On November 28, the bulls made an attempt and pushed the coin towards the supply level of $131 but were unable to break out due to the Bears’ pressure. Ethereum price had its low at $79 on December 7. Throughout last week ETH price was consolidating within the range of $103 price level and $79 demand level.
Currently, strong bullish candles are emerging, pushing the ETH price towards the supply level of $103 which is an indication that bulls are gradually gaining momentum. Should the bulls succeed in breaking up the supply level of $103, it will rally to the north and target the strong supply level of $131. In case the bears defend the price level of $103 and the price bounce to break the demand level of $79 downside, Ethereum price will have its low at $60 demand level.
The 50-day EMA remain above the 20-day EMA while the ETH price is below the two EMAs far apart from each other which indicate that the crypto is under a strong bearish pressure. The Relative Strength Index period 14 is at 40 levels parallel to the level without direction indicates that consolidation is ongoing. Traders should be patient and be on the lookout for the breakout to take a position.
ETH/USD Medium-term Trend: Bullish
On the medium-term outlook, ETH/USD is in a bullish trend. The bears lose the pressure on December 15 at the level close to the demand level of $79; this is clearly seen as the inside bar candle pattern formed to reverse the trend on the 4-Hour chart. ETH price rallied to the north broke up the two dynamic support and resistance.
Ethereum price is currently above the 50-day EMA while the 21-day EMA is below making an attempt to cross upside the 50-day EMA which indicates that the bulls are gaining momentum in order to change the trend to an uptrend. However, the Relative Strength Index is above 60 levels bending down indicates sell signal which may be a pullback after which the uptrend may continue.
Azeez Mustapha is a specialist in Computer Studies (including DTP), Forex and Crypto trading professional. Being expert technical and currency analyst, as well as experienced fund manager and author of several books, Azeez places strong focus on crypto market studies conducting comprehensive price analyses and sharing forecasts of presumptive market trends.

 ETH remains in its bearish trend on the long-term outlook. The bears still hold tight to the Ethereum market without giving space to the bulls. On November 28, the bulls made an attempt and pushed the coin towards the supply level of $131 but were unable to break out due to the Bears’ pressure. Ethereum price had its low at $79 on December 7. Throughout last week ETH price was consolidating within the range of $103 price level and $79 demand level.
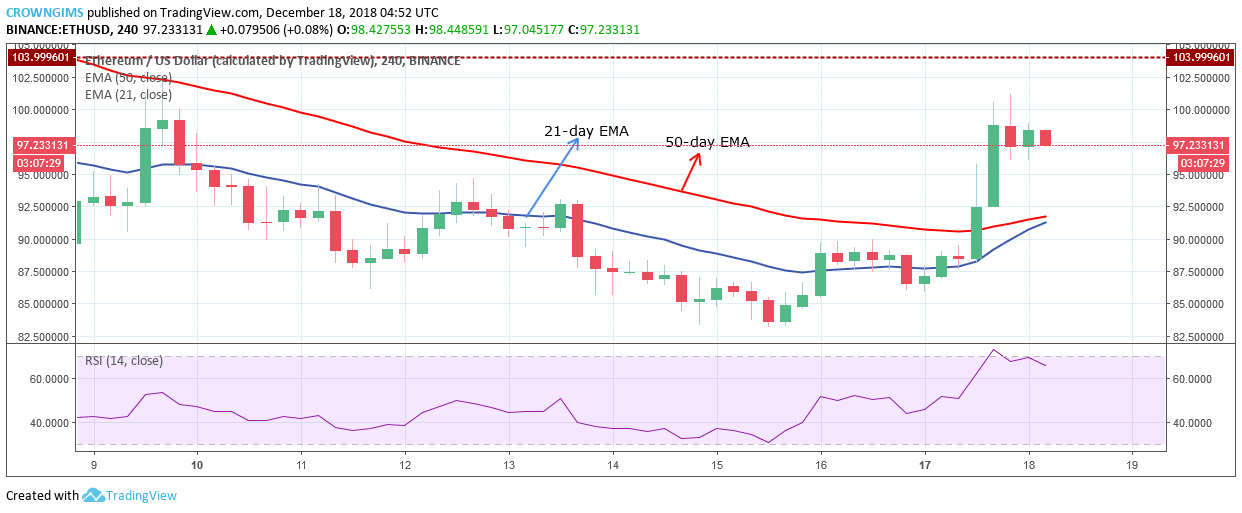 On the medium-term outlook, ETH/USD is in a bullish trend. The bears lose the pressure on December 15 at the level close to the demand level of $79; this is clearly seen as the inside bar candle pattern formed to reverse the trend on the 4-Hour chart. ETH price rallied to the north broke up the two dynamic support and resistance.


