Ethereum Price Analysis: Will ETH HODL $3,300 or Retest $2,900?
As investors turn fearful in the falling crypto market, Ethereum nears a buy-the-dip level. With analysts targeting this pullback for a massive reversal potential, should you consider buying in a bleeding market?
In the 4-hour chart, Ethereum price action reveals a bullish failure to sustain above the 61.80% Fibonacci level at $3,667. As the bullish failure resulted in a pullback, the broader market crash fueled the correction rally.
The Ethereum price is now down to $3,300 near the 23.60% Fibonacci level. While taking a lateral shift with multiple Doji’s along the way, the slowdown in bearish momentum is clearly evident in the Ethereum price trend.
As the biggest altcoin takes a lateral shift, the prevailing downfall has resulted in a death cross event. However, the 4-hour RSI line seeks a bullish opportunity as it highlights a divergence at play. Furthermore, it is starting to emerge from the oversold zone, signaling a potential trend reversal.
Analyst Finds an Extremely Bullish Pattern That Demands $2,900 Retest
Despite the strong chances of a pullback in Ethereum, Ali Martinez, an independent analyst, highlights this as an excellent buy-the-dip opportunity. In the 12-hour price chart of Ethereum, Ali highlights a potential inverted head-and-shoulder pattern.
A downswing to $2,900 will be very bullish for #Ethereum$ETH, as it creates an excellent buy-the-dip opportunity to target $7,000 next!
The neckline of this extremely bullish pattern coincides with the $4,000 psychological mark. As the chances of a pullback in Ethereum grow, a downswing to $2,900 will increase the chances of a right-shoulder pattern. Based on the bullish pattern, the price chart highlights a potential price target of $7,000.
However, for momentum traders, the breakout of the $4,000 mark will provide a better opportunity at a lesser risk if the bullish pattern sustains.
Ethereum Derivatives and ETFs Turn Red
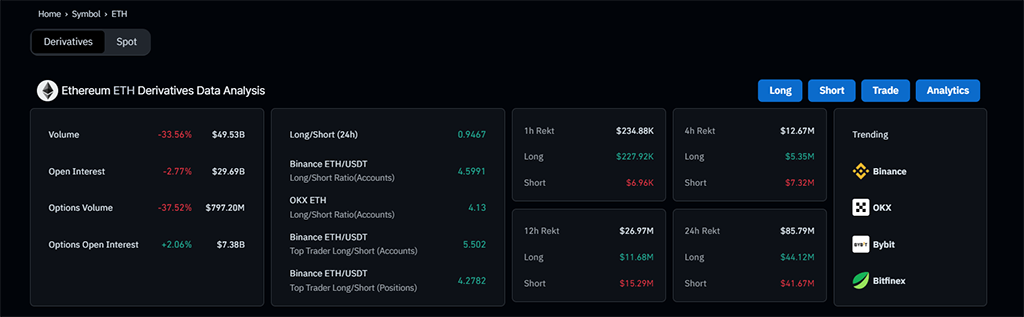
Despite the short-term chances of a bullish recovery, the Ethereum derivatives data analysis reveals a strong bearish influence. The Ethereum open interest is down to $29.69 billion, registering a 2.77% drop in 24 hours. Furthermore, the long-to-short ratio has reached 0.9467, reflecting a strong selling sentiment.
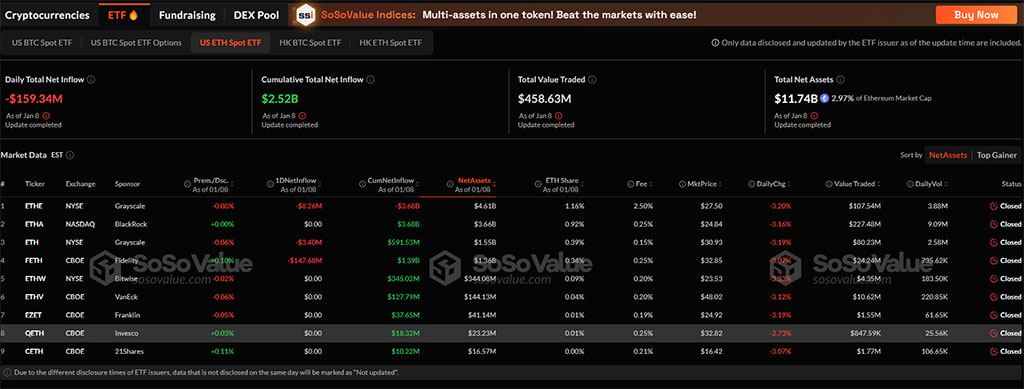
While the liquidations in the crypto market have reached $480 million, the Ethereum liquidations stand at $85.79 million in the past 24 hours. On a side note, as Bitcoin spot ETFs in the US record their second-largest outflow ever, the Ethereum spot ETF maintains a bearish approach.
On January 8, the Ethereum spot ETFs recorded an outflow of $159 million. Driving the bearish pack, Fidelity’s FETH ETF recorded an outflow of $147.68 million, while Grayscale Trust and Minitrust recorded an outflow of $11.66 million in total. The rest of the ETFs recorded a net zero outflow. And its second-largest outflow ever.
ETH Price Targets $3,500 Next Week
The short-term price trend in Ethereum suggests a potential recovery run to the 50% Fibonacci level at $3,446 based on the RSI divergence. However, the bullish failure to sustain the $3,300 mark amid the broad market crash could retest the $3,100.
Furthermore, the long-term price trend by Ali highlights the demand for a potential retest to the $2,900-$3,000 psychological mark for an inverted head-and-shoulder pattern.
Disclaimer: Coinspeaker is committed to providing unbiased and transparent reporting. This article aims to deliver accurate and timely information but should not be taken as financial or investment advice. Since market conditions can change rapidly, we encourage you to verify information on your own and consult with a professional before making any decisions based on this content.
Vishal, a Bachelor of Science graduate, began his journey in the crypto space during the 2021 bull run and has since navigated the subsequent market winter. With a strong technical background, he is dedicated to delivering insightful articles rich in technical details, empowering readers to make well-informed decisions.