Invesco and Galaxy filed for a Solana ETF under the ticker QSOL.
Analysts suggest a potential breakout for SOL price, with resistance at $150.
Bloomberg analysts assign a 90% chance for Solana ETF approval by July.
Invesco and Galaxy have become the ninth issuer to file for a spot Solana ETF with the U.S. Securities and Exchange Commission. According to a June 26 filing, the proposed fund, dubbed “QSOL,” will provide direct exposure to Solana SOL$67.9824h volatility:0.7%Market cap:$39.46 BVol. 24h:$3.86 B
.
If approved, QSOL will be listed on the Cboe BZX Exchange, with Coinbase Custody safeguarding the underlying assets. The ETF may also stake a portion of its SOL to generate token rewards, which will be treated as trust income.
This move follows a series of similar filings from VanEck, Bitwise, Grayscale, and Canary Capital, all of which are still under SEC review. Although the regulator has delayed decisions, it hasn’t dismissed the idea of such an approval. The final decision deadline for several of these filings is set for October.
Bloomberg ETF analysts believe the SEC may approve one or more Solana ETFs as early as July, assigning a 90% probability. The prediction market Polymarket echoes this optimism, assigning a 56% chance for approval by July and 90% by year-end.
The market saw a neutral response to the filing. At the time of writing, SOL is trading around $145.6, with no loss or gains in the past day. Analysts predict that an ETF approval could drive major capital inflows and a SOL price rally.
SOL Price Outlook
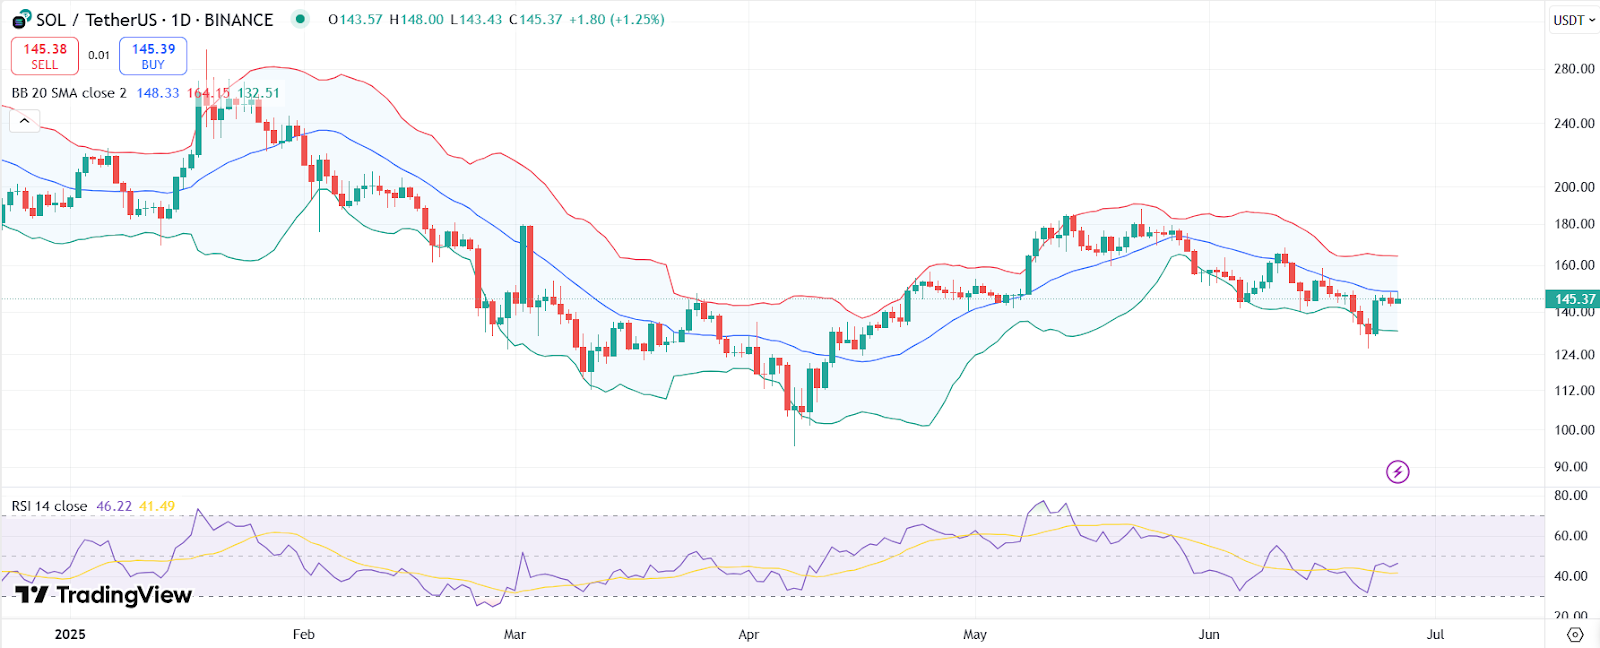
On the daily SOL price chart, the RSI is at 46.22, signaling neutral momentum with neither overbought nor oversold conditions. A further push on the RSI could strengthen bullish momentum. If SOL manages to break the $150 resistance zone, analysts eye $170 as the next target.
SOL price chart with RSI and Bollinger Bands | Source: Trading View
The price is hovering just below the mid Bollinger Band (20-day SMA) at $148.33, which now acts as immediate resistance. Bollinger Bands are narrowing, often leading to a major move. However, if SOL fails to hold $140, it could see a price fall to the $132 support area.
Notably, SOL has been trading in a descending wedge pattern since May 18, a formation generally signaling a bullish breakout. Popular analyst Crypto TA King noted the pattern on X, suggesting a bullish projection to $170 in the near-term.
Disclaimer: Coinspeaker is committed to providing unbiased and transparent reporting. This article aims to deliver accurate and timely information but should not be taken as financial or investment advice. Since market conditions can change rapidly, we encourage you to verify information on your own and consult with a professional before making any decisions based on this content.
A crypto journalist with over 5 years of experience in the industry, Parth has worked with major media outlets in the crypto and finance world, gathering experience and expertise in the space after surviving bear and bull markets over the years. Parth is also an author of 4 self-published books.