Monero (XMR) Price Analysis: Trends of August 16–22, 2018
XMR continues its downward trending after breaking of $130 distribution level, the pair will experience further downward movement and get exposed to another strong accumulation level at $55.
By Azeez Mustapha
Updated
2 mins readPhoto: Shutterstock
Key Highlights
There is a Bearish Confimation Pattern in the Monero daily chart;
the more the price goes donwwards, the higher the probability of a strong rally, which may happen anytime;
traders are advised to speculate only on what they see.
XMRUSD Long-term Trend: Bearish
Resistance levels: $110, $120, $130
Support levels: $70, $60, $50
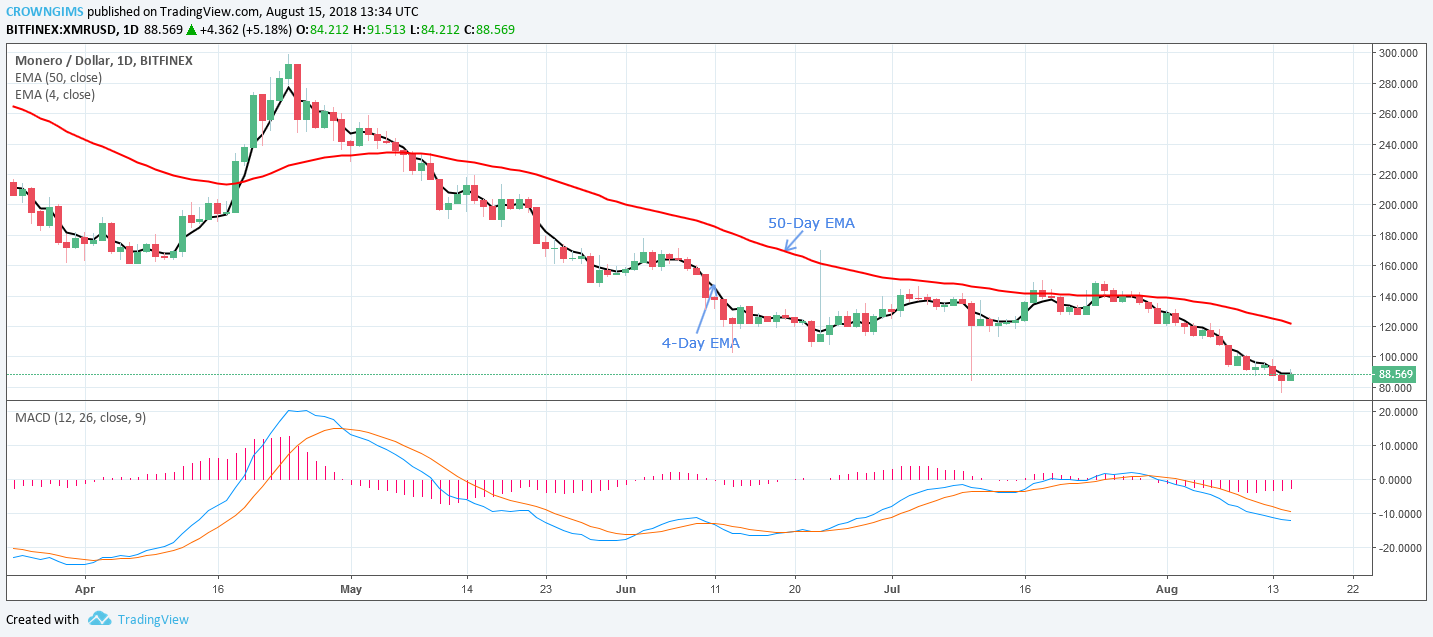
XMR continues its downwards trending after breaking of $130 distribution level. The southwards movement started after consolidation for one week and the 4-day EMA crossed the 50-day EMA downward. Sellers are putting more pressure on the pair, and the price is sliding further downwards. The price is moving away from the 50-day EMA on the Daily chart, which indicates a downwards trend continuation.
Minor Accumulation level of $70 has been tested by the coin, and a bullish retracement is possible (which is supposed to be temporary). The cryptocurrency is presently exposed to the strong accumulation level of $70. Should the strong accumulation level get broken, the pair will experience further downward movement and get exposed to another strong accumulation level at $50. The MACD, with its histogram below the zero level, and the signal lines pointing downwards, indicates that the price may still move down.
XMRUSD Price Medium-term Trend: Bearish
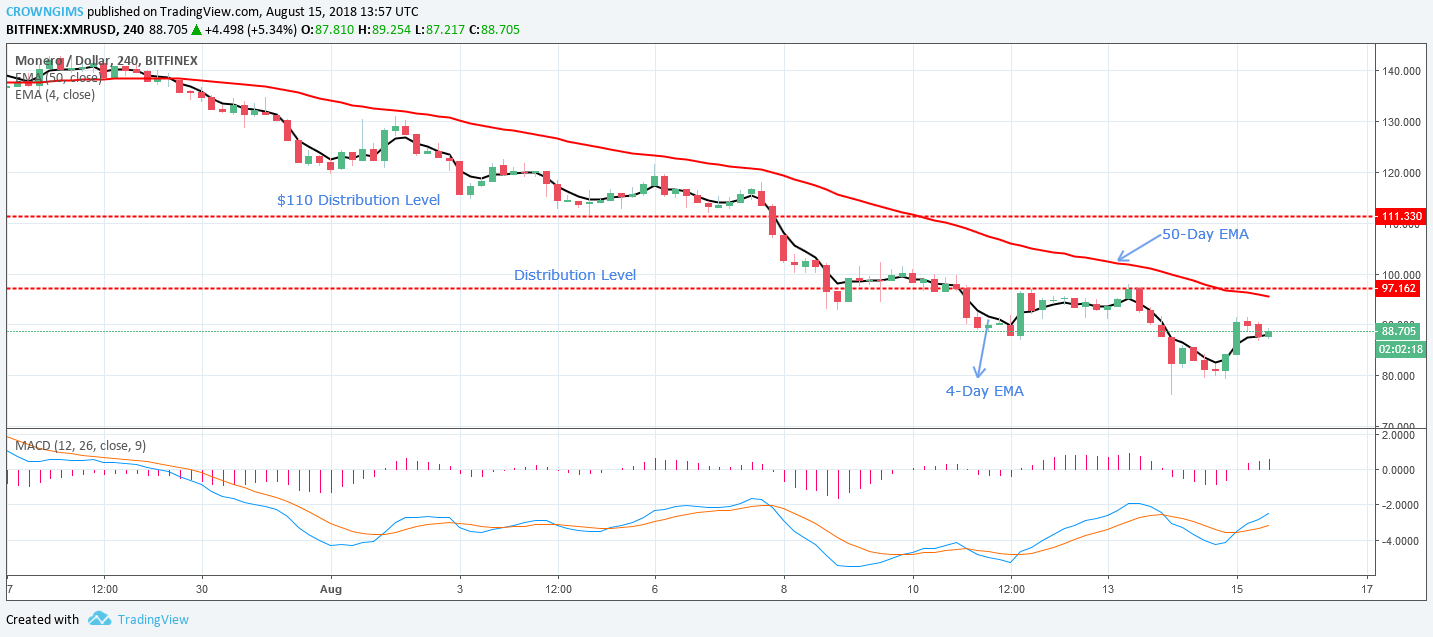
On the 4-Hour chart, Monero formed another consolidation near the $90 price level, last week. After which the price broke the level and bearish journey resumed. A minor accumulation level of $70 was tested and price pulled back to $80, and made retracement to $90. In case retracement continues and the market breaks the distribution level of $110, then an upward movement is possible. The price may resume its bearish movement, should the accumulation level of $70 is broken.
The MACD in the 4-hour chart shows that taking long trade may be logical, as the histogram on MACD is above the 0-level (positive area) and the signal lines are pointing upward.
Azeez Mustapha is a specialist in Computer Studies (including DTP), Forex and Crypto trading professional. Being expert technical and currency analyst, as well as experienced fund manager and author of several books, Azeez places strong focus on crypto market studies conducting comprehensive price analyses and sharing forecasts of presumptive market trends.