Monero (XMR) Price Analysis: Trends of August 9-15, 2018
Monero has been trending downwards for months, thus only a radical fundamental event can forcefully bring about a significant rally in the market.
By Azeez Mustapha
Updated
2 mins readPhoto: Shutterstock
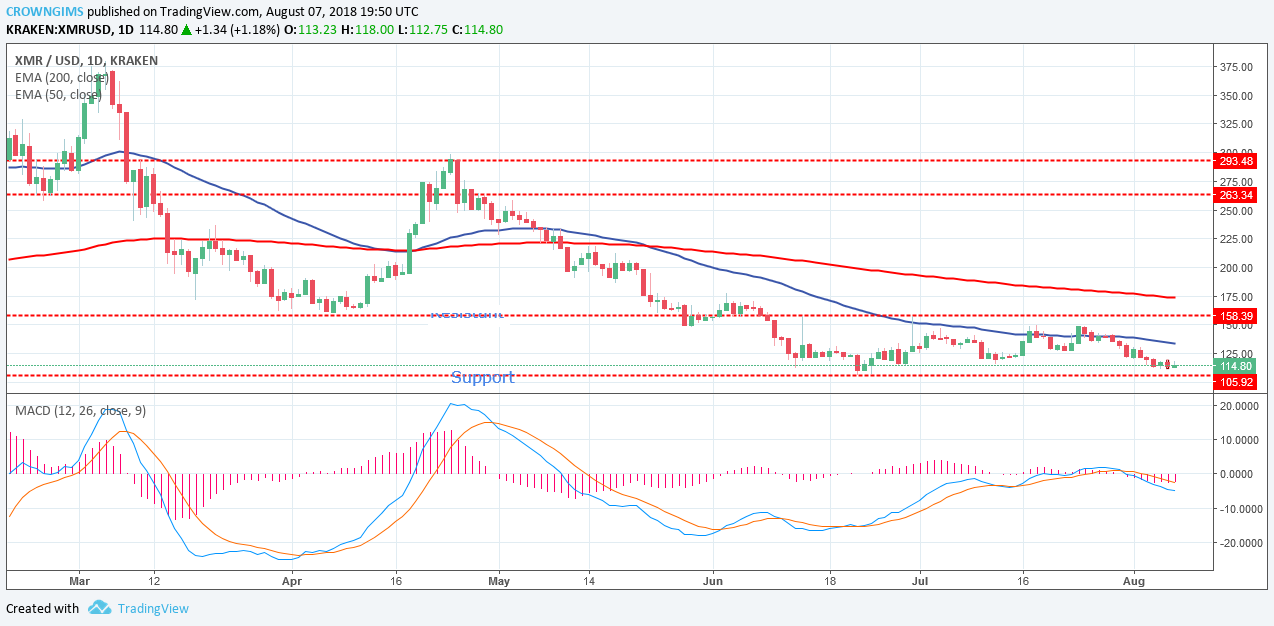
Resistance levels: $130, $140, $150
Support levels: $110, $100, $90
XMRUSD Long-term Trend: Bearish
Monero has been trending downwards for months. The southwards movement started early in 2018 and the 50-day EMA crossed the 200-day EMA downward. Recently, the cryptocurrency tried to retrace upwards but more sellers came in at the resistance level of $150, and price slid further southwards. In the daily chart, the price is close to the 50-day EMA, which connotes possibility of a downwards trend continuation.
Now, the price close to the strong support level at $100, as it forms another bearish candle. Should the strong support level get broken, the pair will drop further and get exposed to another strong support level at $90. MACD, with its histogram below the zero level, indicates that the price may slide southwards.
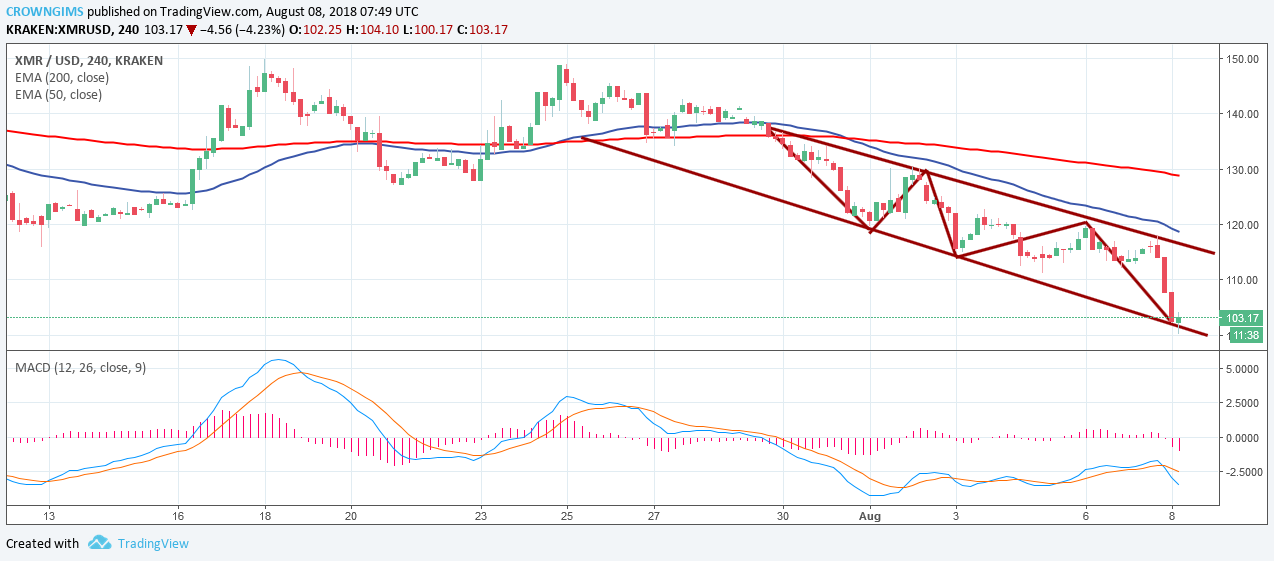
XMRUSD Price Medium-term Trend: Bearish
As evident in the charts, XMRUSD has been very bearish, making higher lows and lower lows for weeks. The price has been experiencing what can rightly be called persistent bearishness, in spite of abortive rally effort and occasional equilibrium phases, which are transitory in nature.
The MACD in the 4-hour chart also supports short trades, thus making long trades illogical at the moment. XMR may attempt to retrace to the upper trend lines. However, it would encounter stiff resistance along the way. Only a radical fundamental event can forcefully bring about a significant rally in the market.
Azeez Mustapha is a specialist in Computer Studies (including DTP), Forex and Crypto trading professional. Being expert technical and currency analyst, as well as experienced fund manager and author of several books, Azeez places strong focus on crypto market studies conducting comprehensive price analyses and sharing forecasts of presumptive market trends.