Stellar Price Analysis: XLM/USD Trends of January 31–February 06, 2019
In case the bulls defend the demand level of $0.07 and increase their momentum, there will be a change of trend to the north side and Stellar price may incline towards $0.10 supply level. If not downtrend continues.
By Azeez Mustapha
Updated
2 mins readPhoto: Marco Verch / Flickr
Key Highlights:
There was a price retracement on the 4-Hour chart;
Stellar price is consolidating below $0.09 price level;
further price declination is anticipated.
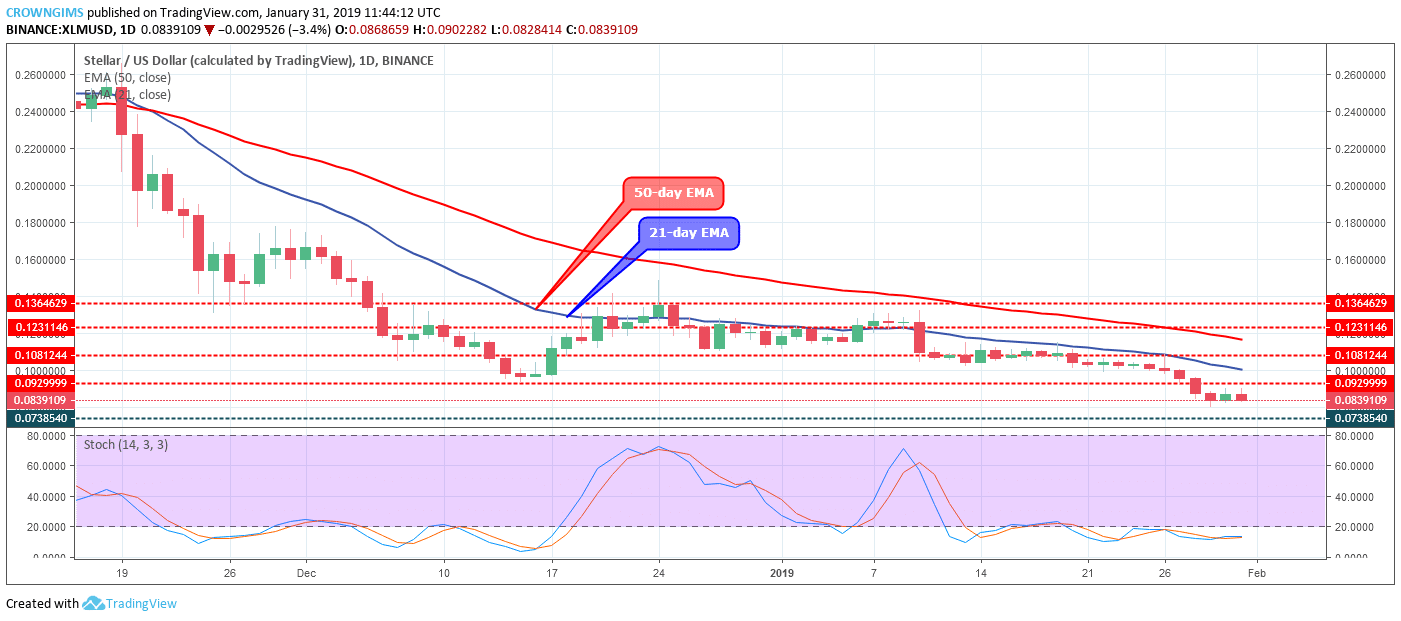
XLM/USD Price Long-term Trend: Bearish
Supply levels: $0.09, $0.10, $0.12
Demand levels: $0.07, $0.06, $0.05XLM/USD still maintains its bearish trend on the long-term outlook. There was a further increase in the bears’ pressure; the previous low of $0.09 was reached (that was the level the coin reached last year December 15). The bearish pressure extended downward and the demand level of $0.09 was penetrated, the bearish candle closed below the level after which the coin started consolidation facing the demand level of $0.07 as at present.
More bearish candles were emerging as a sign of increasing bearish momentum. Stellar price still found ranging below the two EMAs. The Stochastic Oscillator period 14 is below 20 levels (oversold region) and the signal lines horizontally flat at the level confirm the ongoing consolidation movement on the XLM market which may be for a short period of time.
In case the bulls defend the demand level of $0.07 and increase their momentum, there will be a change of trend to the north side and Stellar price may incline towards $0.10 supply level. If not downtrend continues.
XLM/USD Price Medium-term Trend: Bearish
XLM/USD is on its bearish trend on the medium-term outlook. An attempt was made by the bulls to reverse the trend on January 26 but the bears opposed the uptrend movement and a bearish candle pattern called “inside bar” was formed which made the coin to fall, broke the $0.09 price level downside towards $0.07 demand level. On January 29, it carried out price retracement and presently resumes its downtrend movement.
The Stochastic Oscillator period 14 is at 50 levels with its signal lines pointing down connotes sell signal. The 50-day EMA remains above the 21-day EMA with Stellar price trading below the two EMAs as an indication that the bears’ momentum in the XLM market is increasing. Further decrease in the price of XLM is anticipated.
Azeez Mustapha is a specialist in Computer Studies (including DTP), Forex and Crypto trading professional. Being expert technical and currency analyst, as well as experienced fund manager and author of several books, Azeez places strong focus on crypto market studies conducting comprehensive price analyses and sharing forecasts of presumptive market trends.

 XLM/USD still maintains its bearish trend on the long-term outlook. There was a further increase in the bears’ pressure; the previous low of $0.09 was reached (that was the level the coin reached last year December 15). The bearish pressure extended downward and the demand level of $0.09 was penetrated, the bearish candle closed below the level after which the coin started consolidation facing the demand level of $0.07 as at present.
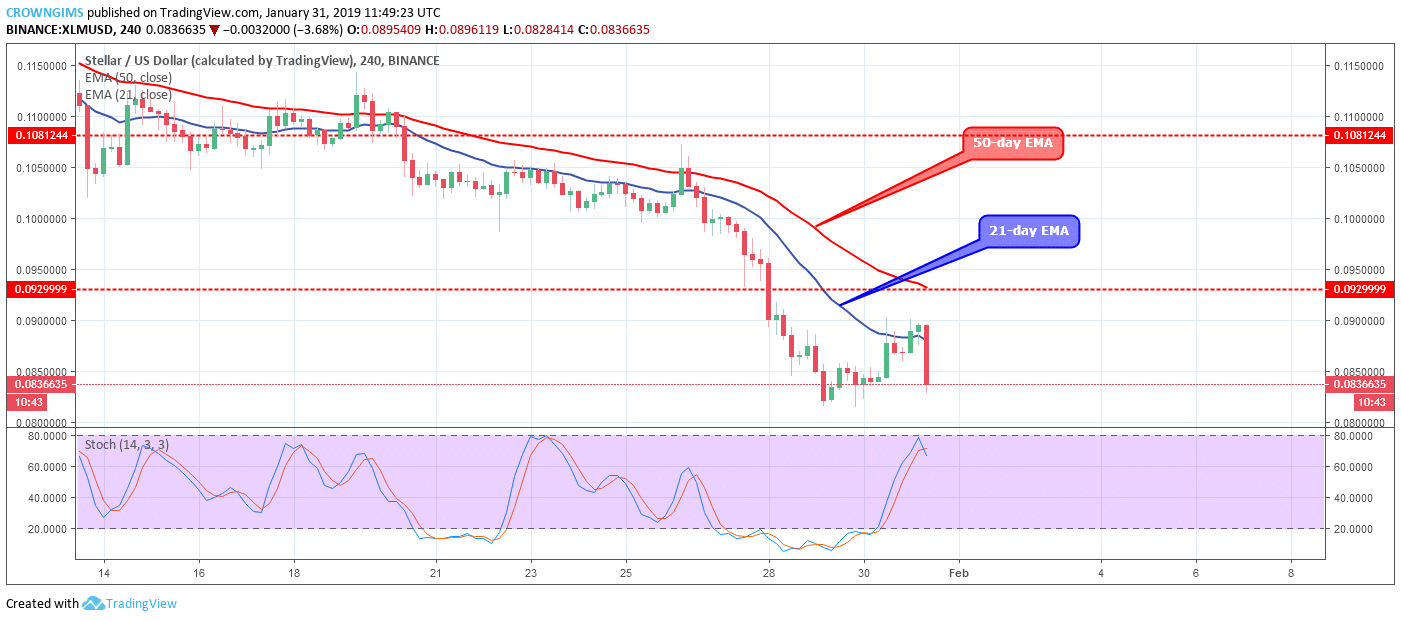 XLM/USD is on its bearish trend on the medium-term outlook. An attempt was made by the bulls to reverse the trend on January 26 but the bears opposed the uptrend movement and a bearish candle pattern called “inside bar” was formed which made the coin to fall, broke the $0.09 price level downside towards $0.07 demand level. On January 29, it carried out price retracement and presently resumes its downtrend movement.