Stellar Price Analysis: XLM/USD Trends of November 15-21, 2018
The strong bearish candle that broke down the demand levels of $0.25 and $0.23 and closed below the dynamic support and resistance is an indication that downtrend movements in Stellar price may continue.
By Azeez Mustapha
Updated
2 mins readPhoto: QuoteInspector
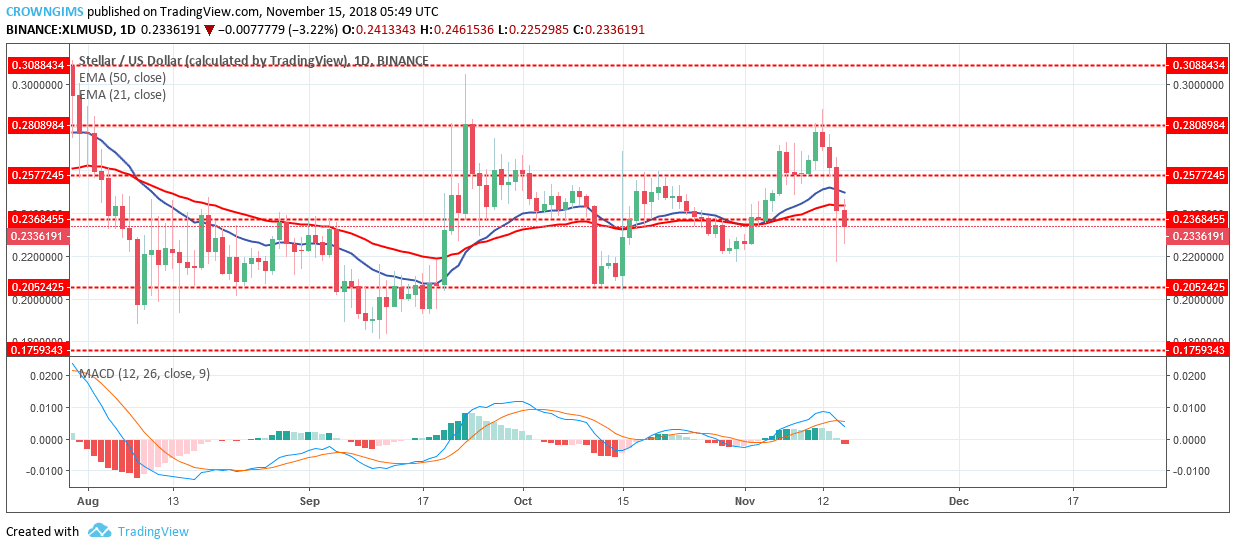
Supply levels: $0.23, $0.25, $0.28
Demand levels: $0.20, $0.17, $0.13Stellar is bearish on its long-term outlook. The bullish pressure got exhausted at the supply level of $0.28 on November 12. The bears returned with high momentum and this was noticed with the formation of an upper long-tailed candle at $0.28 supply level which rejected a further increase of XLM price.
The next daily candle confirmed to the bears’ taking over the XLM market as it was a strong bearish candle that broke down the demand levels of $0.25 and $0.23 and closed below the dynamic support and resistance (the two EMAs).
The daily opening candle is bearish and it broke down the demand level of $0.23; it is an indication that downtrends may continue. Stellar price is currently trading below the supply level of $0.23 heading toward the demand level of $0.20. XLM price is below 50-day EMA and the 21-day EMA which indicates the bears’ pressure is still strong.
Moreover, the MACD period 12 with its histogram is below zero level with its signal lines pointing to the south which indicates a strong selling signal.
In case the bears continue with their increased momentum the Stellar price may have its target at the demand level of $0.20.
XLM/USD Price Medium-term Trend: Bearish
Stellar is in its downtrend on the 4-Hour chart. The formation of “Tweezer Tops” candle formed above $0.28 supply levels shows that bears were returning into the XLM market with high pressure that eventually broke down the former demand levels of $0.28, $0.25, $0.23. The crossing down of 21-day EMA over 50-day EMA is an evidence of strong bearish pressure.
XLM price is currently below $0.23 supply level exposed to the demand level of $0.20. XLM price is below 21-day EMA and 50-day EMA which connotes bearish trend and also MACD with its histogram is below zero level with its signal lines point down indicates sell signal.
Azeez Mustapha is a specialist in Computer Studies (including DTP), Forex and Crypto trading professional. Being expert technical and currency analyst, as well as experienced fund manager and author of several books, Azeez places strong focus on crypto market studies conducting comprehensive price analyses and sharing forecasts of presumptive market trends.

 Stellar is bearish on its long-term outlook. The bullish pressure got exhausted at the supply level of $0.28 on November 12. The bears returned with high momentum and this was noticed with the formation of an upper long-tailed candle at $0.28 supply level which rejected a further increase of XLM price.
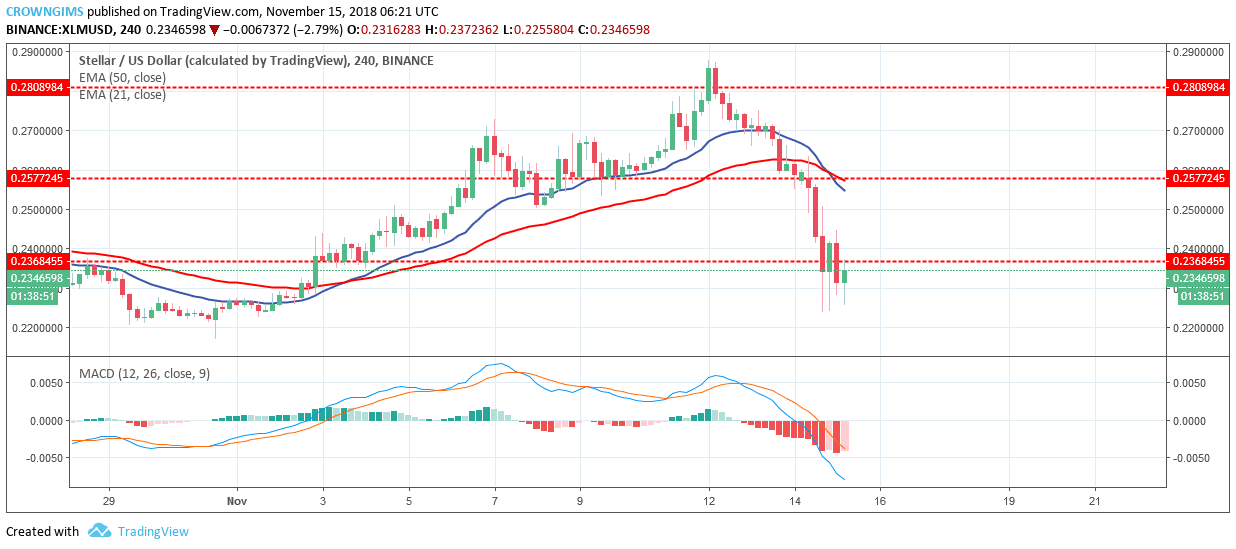 Stellar is in its downtrend on the 4-Hour chart. The formation of “Tweezer Tops” candle formed above $0.28 supply levels shows that bears were returning into the XLM market with high pressure that eventually broke down the former demand levels of $0.28, $0.25, $0.23. The crossing down of 21-day EMA over 50-day EMA is an evidence of strong bearish pressure.