The sudden sell-off has been fueled in part by large holders exiting their positions. According to data shared by LookonChain, two whales offloaded over $5.5 million worth of AAVE in recent hours.
As the market dropped, 2 whales dumped 24,936 $AAVE($5.51M).
0x1f4A deposited 15,646 $AAVE($3.45M) to #Binance 7 hours ago.
Earlier today, whale address 0x1f4A deposited 15,646 AAVE (worth around $3.45 million) to Binance, while 0x8d8B sold 9,290 AAVE for 2.05 million USDC on Sunday night. These movements have shaken short-term investor confidence.
AAVE Price Outlook
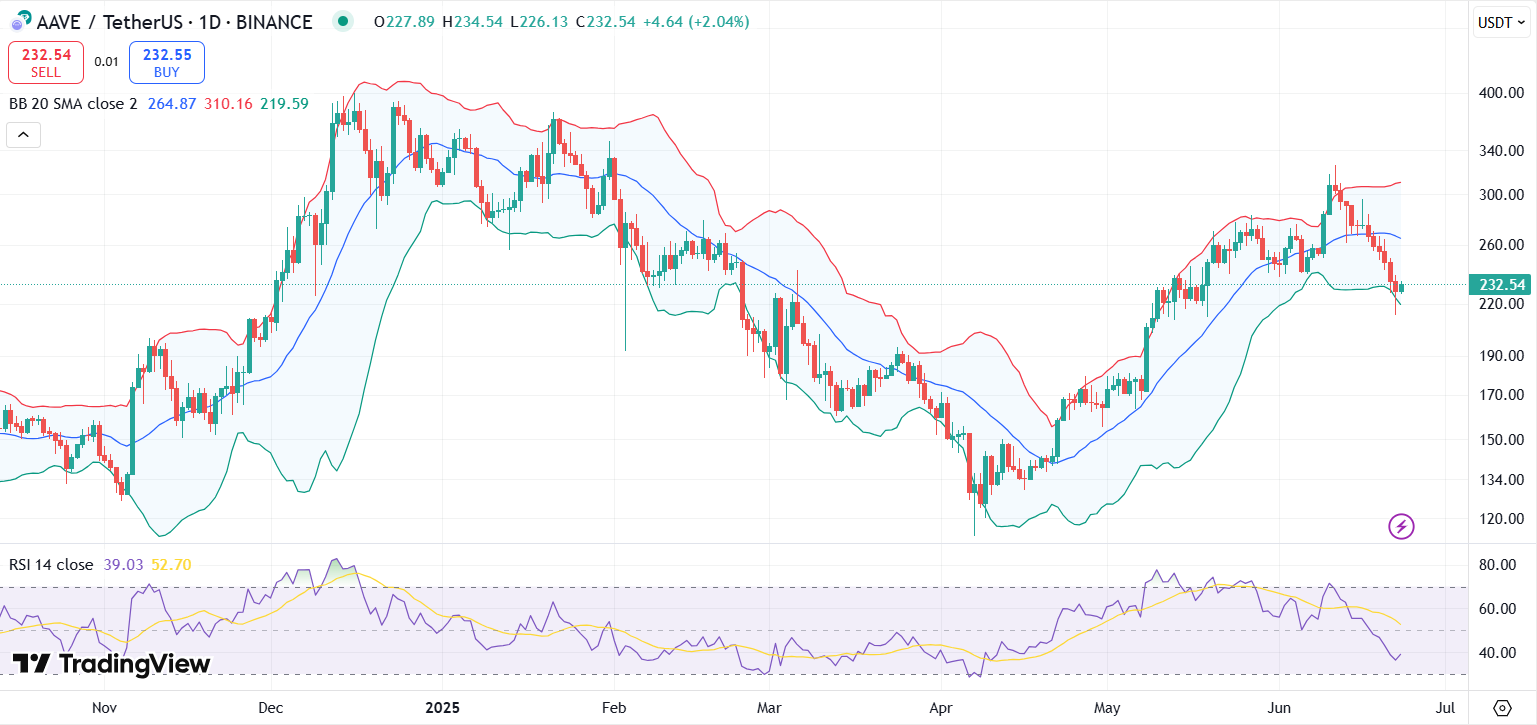
On the daily AAVE price chart, the RSI is indicating that the 30th largest cryptocurrency is nearing the oversold territory. This could suggest a potential bounce if buying volume returns.
AAVE price chart with RSI and Bollinger Bands | Source: Trading View
The Bollinger Bands indicate that AAVE has touched the lower band and is currently trading below the midline (20-day Simple Moving Average), typically a bearish signal. However, this also suggests AAVE may be oversold.
If sentiment improves, a mean reversion move toward the midband (around $265) could occur in the short-term. After this level, the next immediate resistance lies at $310.
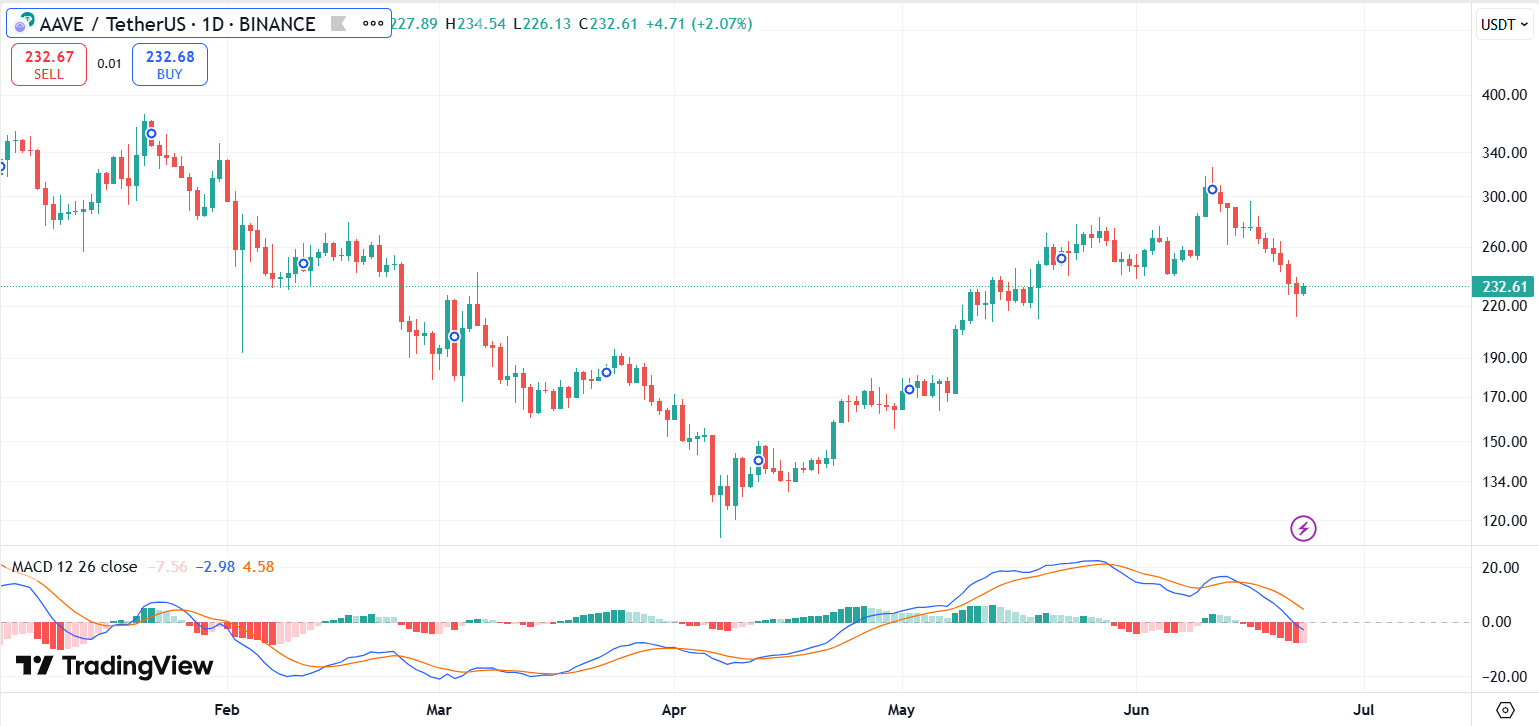
However, the MACD shows continued bearish momentum, with the MACD line sitting below the signal line. Histogram bars are also in the red, reinforcing short-term selling pressure. A break below the $219 support level could expose AAVE to deeper losses to $200.
AAVE price chart with MACD | Source: Trading View
Crypto analyst Smith noted on X that AAVE has been trading within an ascending broadening wedge pattern on the daily chart over the past year. He predicted that if this long-term structure plays out, a possible +168% breakout to the $600 level is possible.
Meanwhile, the broader crypto market is also facing selling pressure. CoinMarketCap data indicate that the total market capitalization has decreased by 1% over the last 24 hours to $3.12 trillion. At the time of writing, major altcoins like Ether (ETH), XRP, and Solana (SOL) are all trading in the red.
Popular crypto analyst, Michael van de Poppe, noted on X that the altcoin season indicator has hit its lowest reading in two years, coinciding with historical data from 2019 to 2024. Traders are increasingly optimistic that a strong altcoin rally could occur soon.
#Altcoin season indicator hits the lowest number in 2 years.
Fun fact, the low of this indicator in the previous years was: – June '19 – June '20 – July '21 – June '22 – June '23 – June '24
Disclaimer: Coinspeaker is committed to providing unbiased and transparent reporting. This article aims to deliver accurate and timely information but should not be taken as financial or investment advice. Since market conditions can change rapidly, we encourage you to verify information on your own and consult with a professional before making any decisions based on this content.
A crypto journalist with over 5 years of experience in the industry, Parth has worked with major media outlets in the crypto and finance world, gathering experience and expertise in the space after surviving bear and bull markets over the years. Parth is also an author of 4 self-published books.