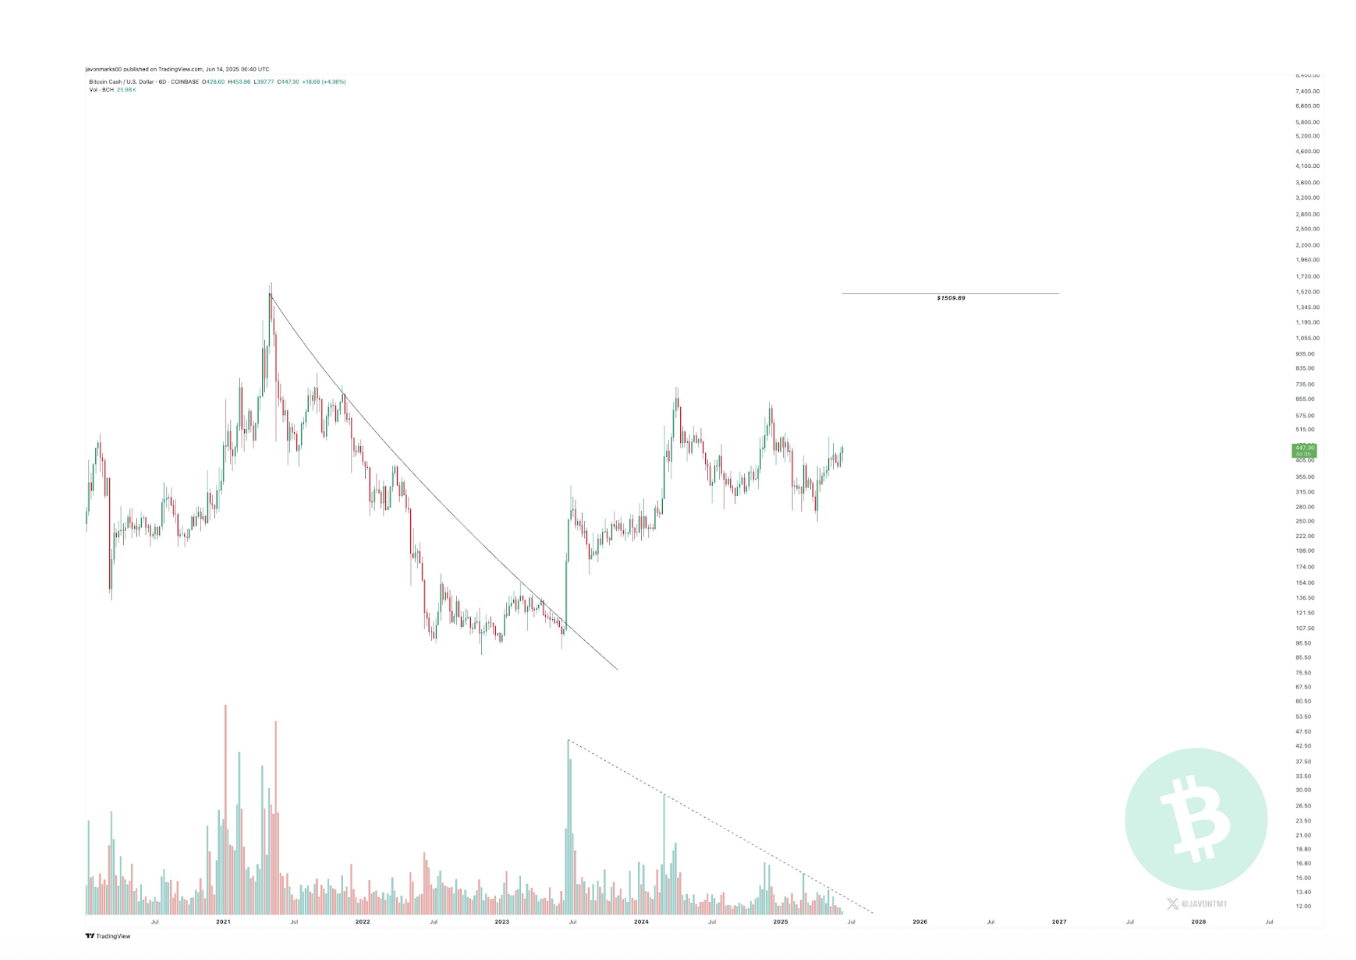
BCH breaks out of a multi-year downtrend with a $1,509 target in sight, according to analyst Javon Marks.
Technical indicators like RSI, MACD, and Fib levels confirm growing bullish momentum for Bitcoin Cash.
If BCH clears the $516 resistance, a parabolic rally toward $1,000+ could quickly follow.
Bitcoin Cash (BCH) has shocked the digital asset space, jumping nearly 5% in the past 24 hours to trade around $436.20, according to CoinMarketCap data, after hitting an intraday high of $453.34.
The surge has led to serious excitement among traders, especially as prominent analyst Javon Marks set an eye-popping price target of $1,509. He has maintained this prediction since March earlier this year.
Javon Marks’ $1,509 Target: The Macro Breakout Thesis
Marks shared a chart, highlighting a significant multi-year downtrend that Bitcoin Cash decisively broke out of in 2023. This descending trendline acted as a resistance barrier since mid-2021, capping price rallies and confining BCH to a prolonged bearish phase.
BCH $1,509 Target | Source: Javon Marks
The breakout above this trendline, paired with the declining volume trend, suggests a “spring coil” effect, where price compresses before a major move.
The $1,509 target is a result of historical price symmetry and technical extension zones from previous accumulation patterns. In technical terms, the chart resembles a classic breakout from a rounded bottom formation, which often leads to exponential moves.
BCH has already confirmed a series of higher highs and higher lows since late 2022, validating the uptrend structure.
Technical Indicators Confirm Strength
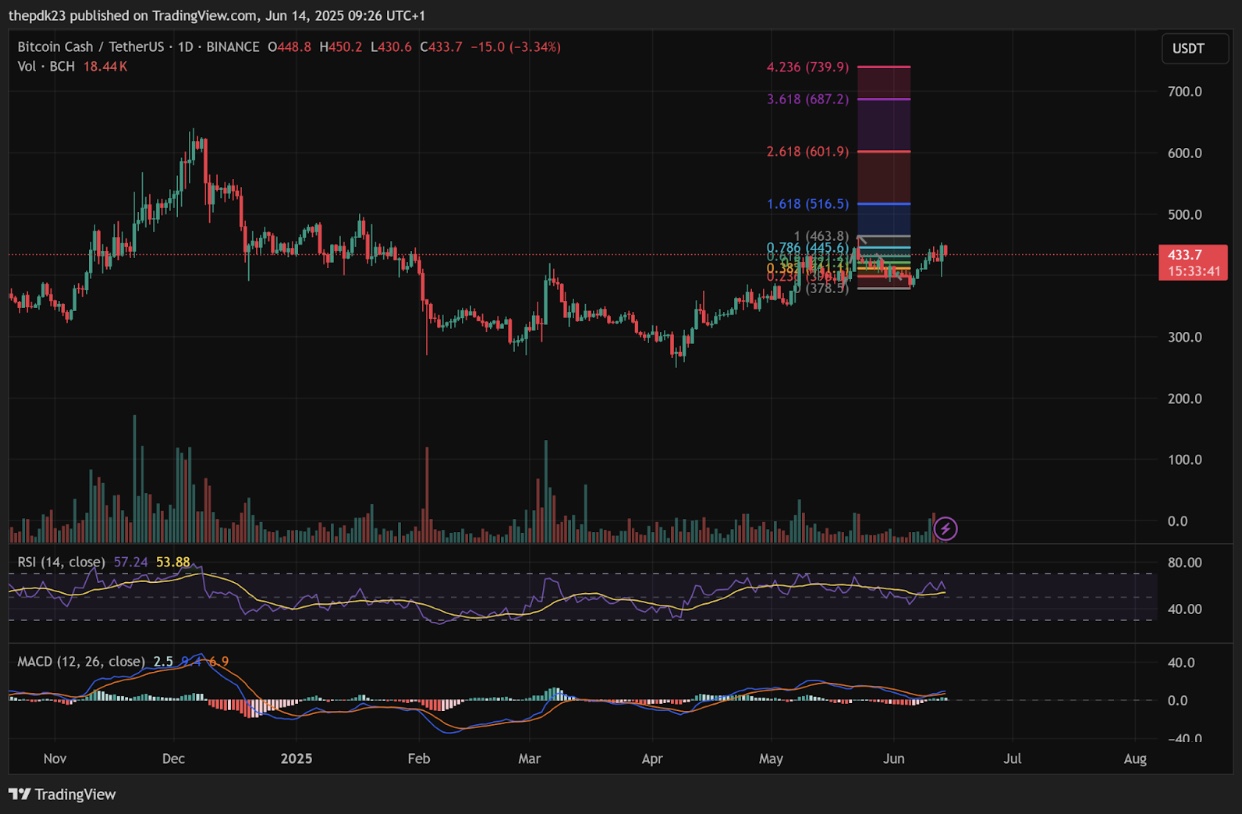
As per the chart below, BCH’s RSI is sitting around 57.24, with the yellow moving average line at 53.88. This suggests moderate bullish momentum without being overbought — a sweet spot for further upside.
The MACD histogram is positive, and the MACD line (blue) has crossed above the signal line (orange), a clear bullish crossover. This momentum shift typically marks the beginning of a new wave up.
Importantly, this crossover happens on the back of consolidation, which means the breakout has solid backing rather than being a fleeting spike.
BCH MACD and RSI Levels | Source: TradingView
Using the Fibonacci extension tool, BCH has already pierced above the 0.786 retracement level at around $445, with the next immediate target being the 1.618 level at $516.5.
Beyond this, Fibonacci projections suggest resistance levels at 2.618 at $601.9, 3.618 at $687.2, and 4.236 at $739.9. These levels align well with Marks’ ultra-bullish outlook.
Should BCH continue climbing through these Fib extensions, $1,000+ becomes a realistic mid-term target, especially if broader crypto market sentiment remains risk-on and demand grows for use cases like instant withdrawal platforms.
Disclaimer: Coinspeaker is committed to providing unbiased and transparent reporting. This article aims to deliver accurate and timely information but should not be taken as financial or investment advice. Since market conditions can change rapidly, we encourage you to verify information on your own and consult with a professional before making any decisions based on this content.
A crypto journalist with over 5 years of experience in the industry, Parth has worked with major media outlets in the crypto and finance world, gathering experience and expertise in the space after surviving bear and bull markets over the years. Parth is also an author of 4 self-published books.