Spot Ethereum ETFs followed with $12.5 million in inflow, their first positive day in nearly a week. Despite the modest recovery, ETF data suggests that investor anxiety remains high with the Fear and Greed Index dropping to 21.
Fear Persists Despite ETF Inflows
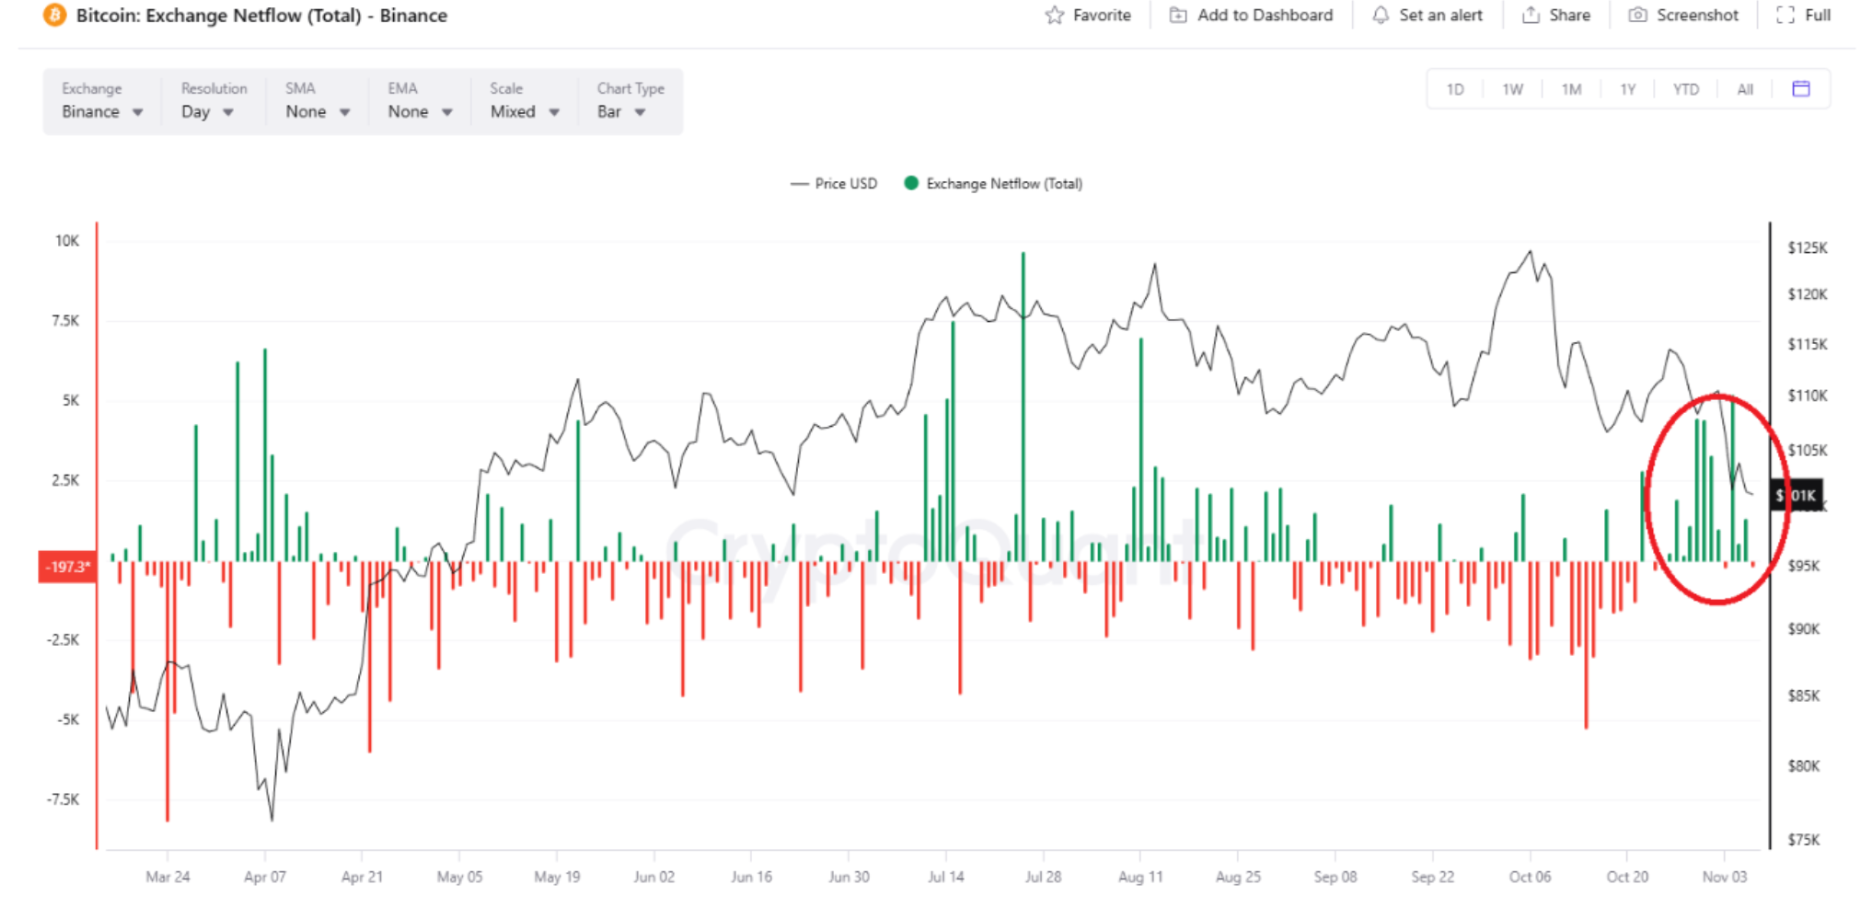
According to CryptoQuant, Bitcoin has yet to reach what analysts describe as a “true capitulation point.” Exchange reserves on Binance continue to rise, suggesting that traders are still sending BTC to exchanges, often an indication of selling rather than accumulation.
The 7-day average of BTC deposits also remains high, and deposit dominance continues to outpace withdrawals.
Also, the Coinbase Premium Index remains negative, representing weak US institutional and retail demand. In previous pullbacks, premium spikes indicated aggressive buying by US investors, but this time, that buying pressure is absent.
Moreover, the Short-Term Holder Realized Profit Ratio (STH RPR) sits at 0.984, far from the panic levels seen during past bottoms. Analysts note that until short-term holders capitulate and strong spot demand returns, Bitcoin is unlikely to establish a definitive floor.
Long-Term Holders Absorb the Pressure
It is important to note that long-term investors, wallets that have never recorded an outflow, are steadily accumulating BTC even as prices fall. The realized price of these permanent holders has climbed to $78,520.
These entities are believed to include institutions, funds, and whales, who are now absorbing the market’s selling pressure. Analysts suggest that unless BTC breaks below the $78.5K realized cost basis, the market is unlikely to enter a full-scale “crypto winter.”
Bitcoin Price Analysis: Holding the Line at $100K
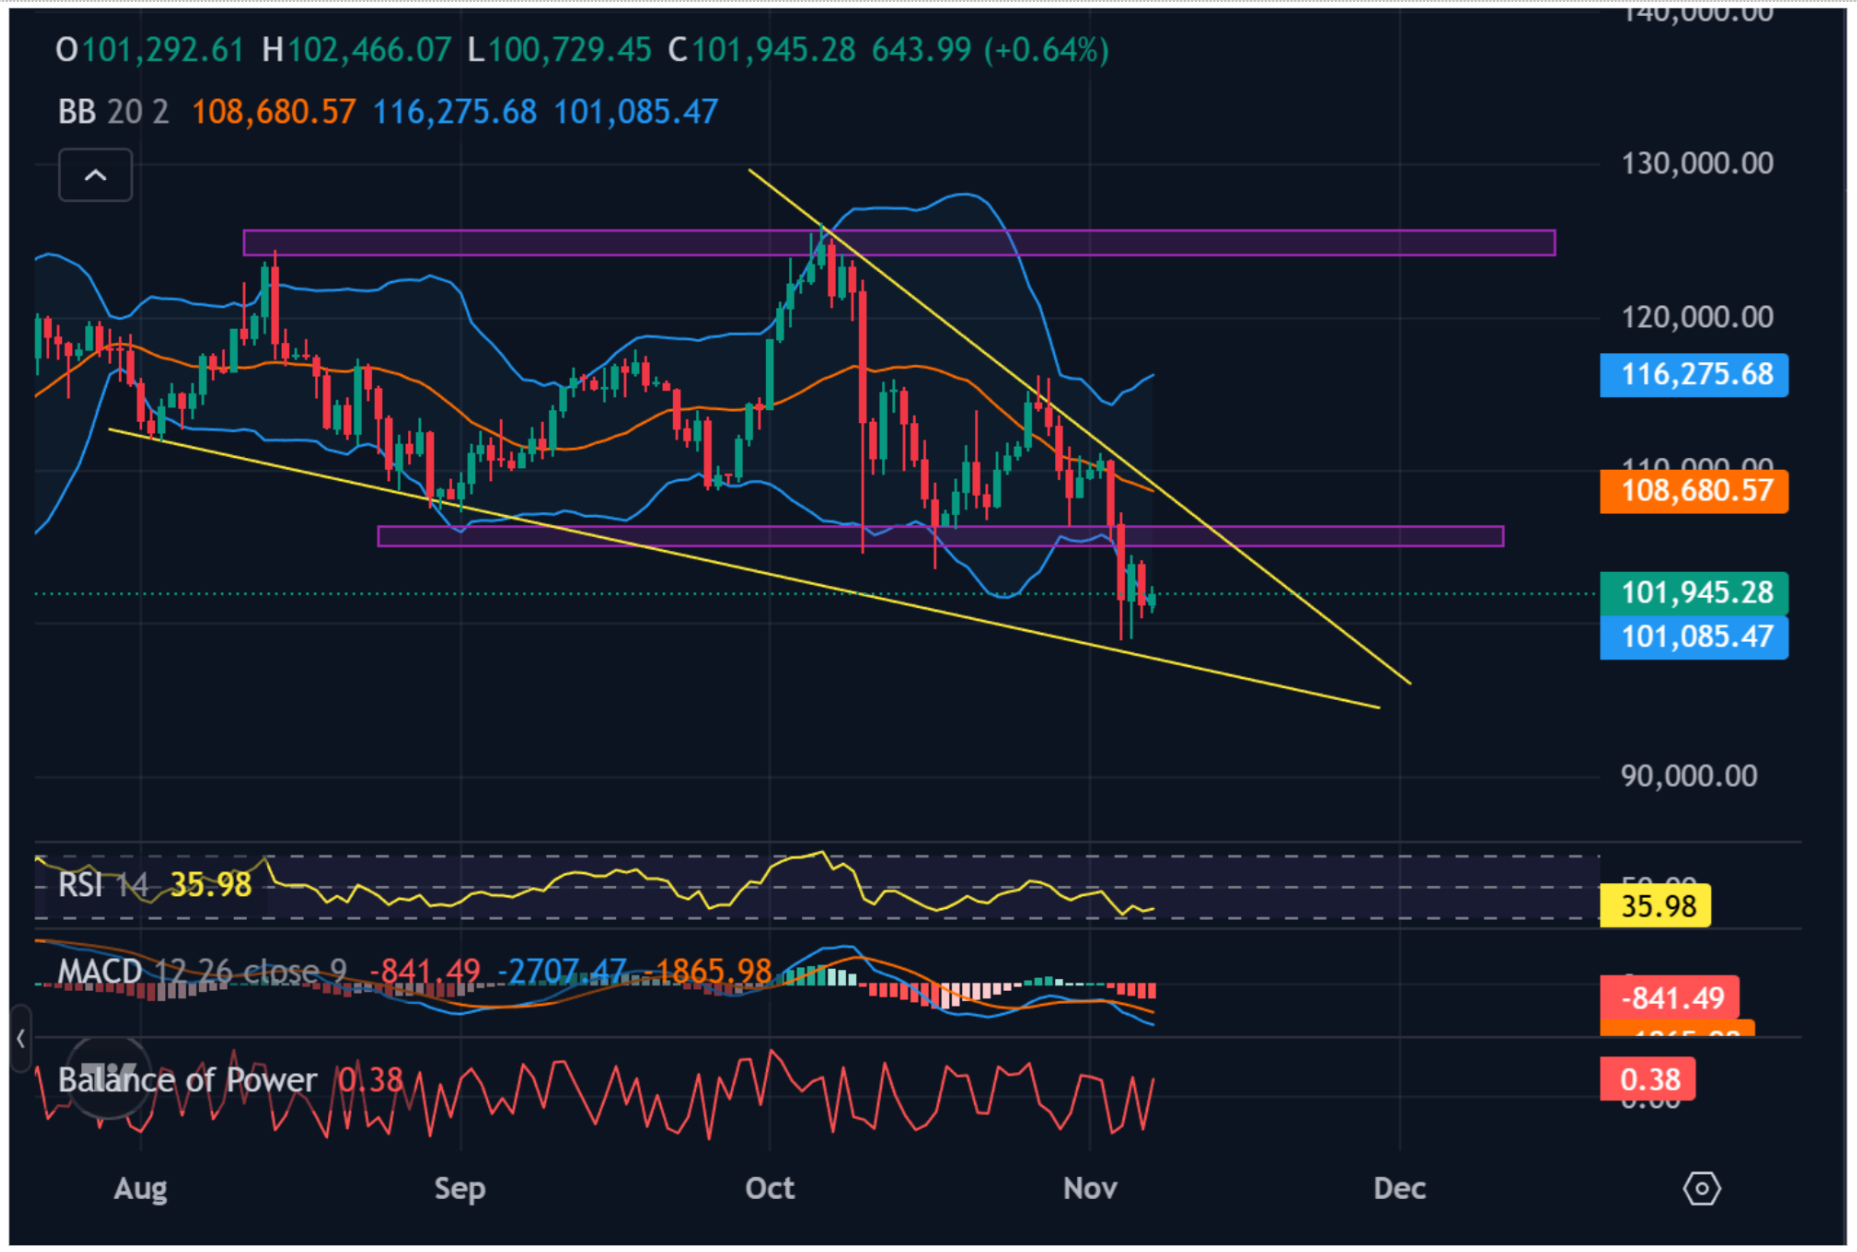
Bitcoin faces a key resistance zone between $103K and $108K, with support firmly at $100K. The Balance of Power (BoP) indicator indicates that buying strength is quietly returning even as price volatility increases. The RSI at 35 points to a neutral-to-oversold setup, while the MACD histogram nears convergence.
Bitcoin daily chart with momentum indicators | Source: TradingView
If Bitcoin can sustain its hold above $100K, it may attempt a relief rally toward $108K or even $115K. A breakdown below the psychological $100K level, however, could accelerate losses toward $95K and test the long-term accumulation zone.
Disclaimer: Coinspeaker is committed to providing unbiased and transparent reporting. This article aims to deliver accurate and timely information but should not be taken as financial or investment advice. Since market conditions can change rapidly, we encourage you to verify information on your own and consult with a professional before making any decisions based on this content.
A crypto journalist with over 5 years of experience in the industry, Parth has worked with major media outlets in the crypto and finance world, gathering experience and expertise in the space after surviving bear and bull markets over the years. Parth is also an author of 4 self-published books.