Bitcoin SV Price Analysis: Bitcoin SV/USD Trends of February 28–March 06, 2019
The bullish trend continues as long as the Bulls maintain or increase their pressure and Bitcoin SV may have its resistance at $85 price level. In case the support level does not hold, BSV will find its low at $54 price level.
the downtrend may continue in case the $68 support level break.
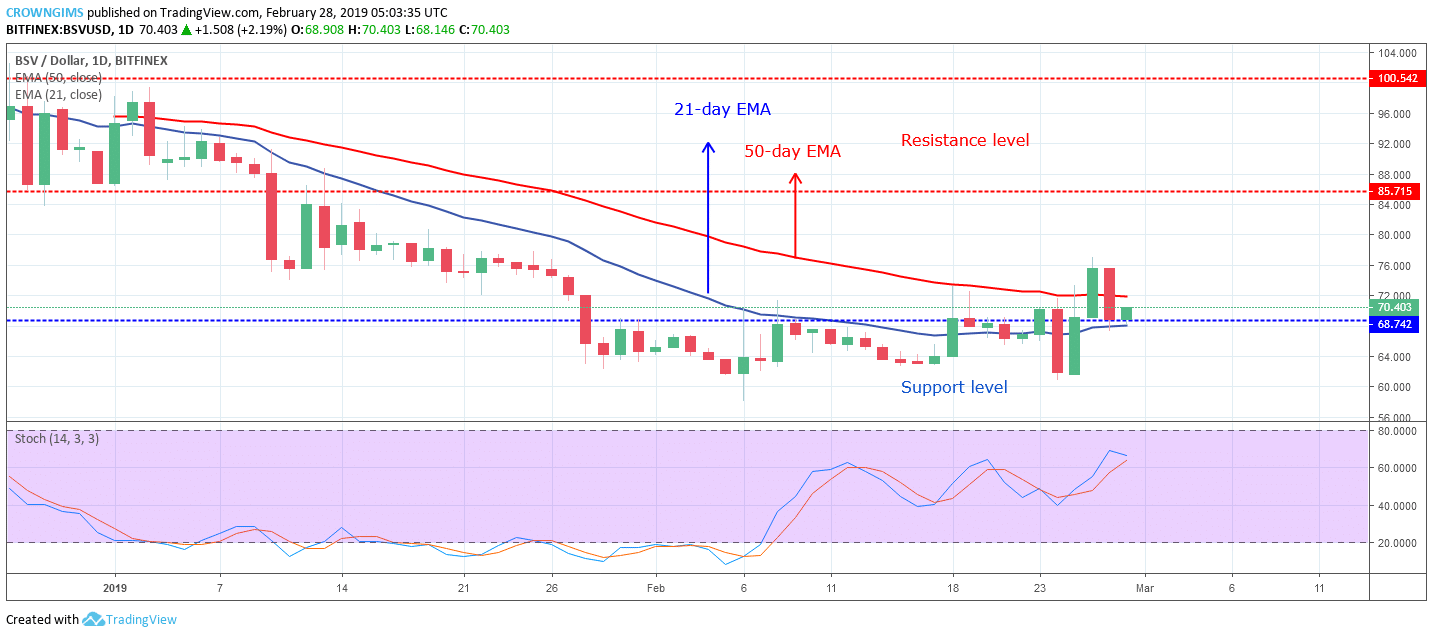
BSV/USD Price Long-term Trend: Bullish
Resistance levels: $85, $100, $114
Support levels: $68, $54, $41Bitcoin SV/USD is bullish on the Long–term. Last week, Bitcoin SV price was range-bound within $68 resistant level and $54 support level. A kind of confluence was noticed at $68 price level. A piercing line candle pattern formed on February 25 indicates the increase in the bullish momentum and it is also a bottom reversal signal; this made the bulls to break up the former resistance level of $68 and also the two dynamic resistance level.
The coin is now exposed to the resistance level of $85. It is currently carrying out retest.
The BSV is already placed in between the two EMAs, in which the 50-day EMA is above the 21-day EMA. The Stochastic Oscillator period 14 is at 60 levels with the signal lines pointing up to indicate that the bullish momentum may increase and it is also a buy signal.
The bullish trend continues as long as the Bulls maintain or increase their pressure and the coin may have its resistance at $85 price level. In case the support level does not hold, the coin will find its low at $54 price level.
BSV/USD Price Medium-term Trend: Bullish
Bitcoin SV/USD continues its uptrend movement on the medium-term outlook. A cup shape with handle candle pattern was formed on the 4-Hour chart. The bearish trend pushed the coin down to $61 mark and the bulls opposed the further downtrend and gained enough pressure that pushed the coin up and broke up the $68 price level and rally towards $85 but unable to reach the target. The bears rejected further increase in Bitcoin SV price.
The Bitcoin SV is on the $68 support level, in case the bearish candle break down the level and close below it, the coin will decline further towards $54 price level, if not, then the crypto will bounce and rally to the north. Meanwhile, BSV is in between the 21-day EMA and the 50-day EMA and the Stochastic Oscillator is at 20 levels (oversold level) gradually bending up which indicates buy signal.
Azeez Mustapha is a specialist in Computer Studies (including DTP), Forex and Crypto trading professional. Being expert technical and currency analyst, as well as experienced fund manager and author of several books, Azeez places strong focus on crypto market studies conducting comprehensive price analyses and sharing forecasts of presumptive market trends.

 Bitcoin SV/USD is bullish on the Long–term. Last week, Bitcoin SV price was range-bound within $68 resistant level and $54 support level. A kind of confluence was noticed at $68 price level. A piercing line candle pattern formed on February 25 indicates the increase in the bullish momentum and it is also a bottom reversal signal; this made the bulls to break up the former resistance level of $68 and also the two dynamic resistance level.
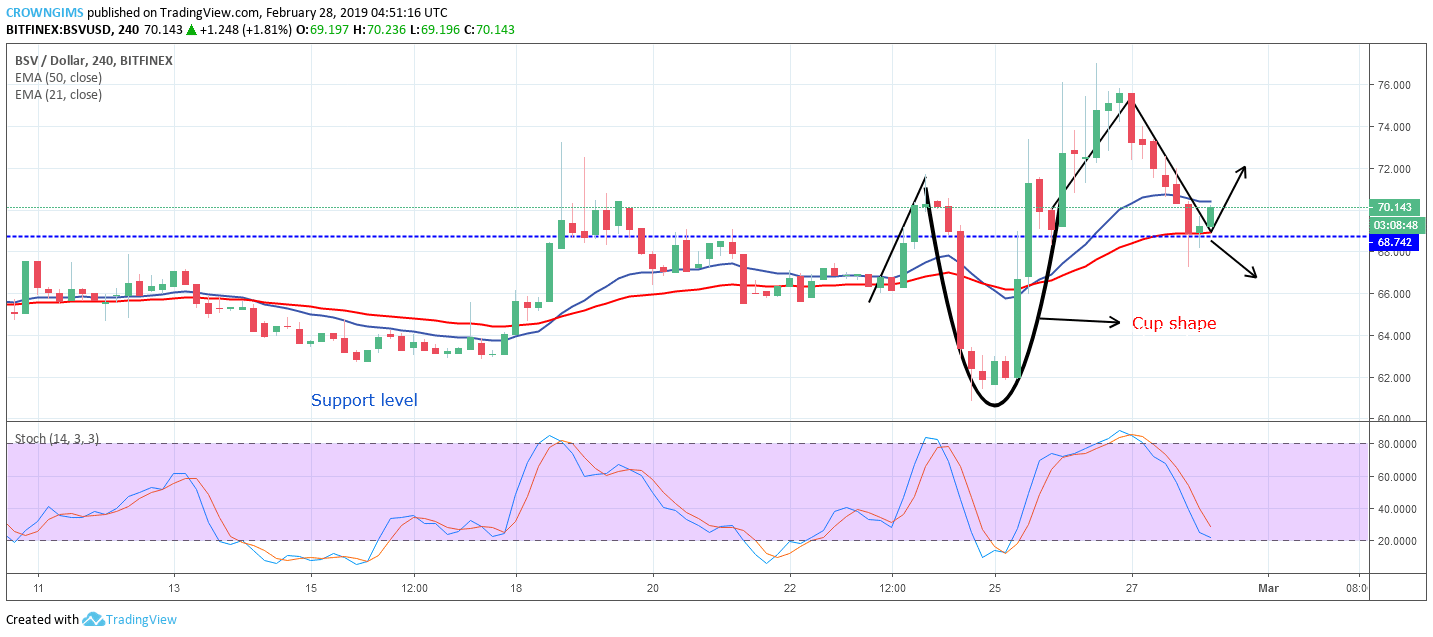 Bitcoin SV/USD continues its uptrend movement on the medium-term outlook. A cup shape with handle candle pattern was formed on the 4-Hour chart. The bearish trend pushed the coin down to $61 mark and the bulls opposed the further downtrend and gained enough pressure that pushed the coin up and broke up the $68 price level and rally towards $85 but unable to reach the target. The bears rejected further increase in Bitcoin SV price.