Bitcoin SV Price Analysis: BSV/USD Trends of January 09–15, 2019
The breakdown of the support level of $85 with the strong bearish candle closed below the level will make Bitcoin SV to have its target at $80 support level.
on the short-term bullish momentum turned bearish on January 3;
the downtrend may continue.
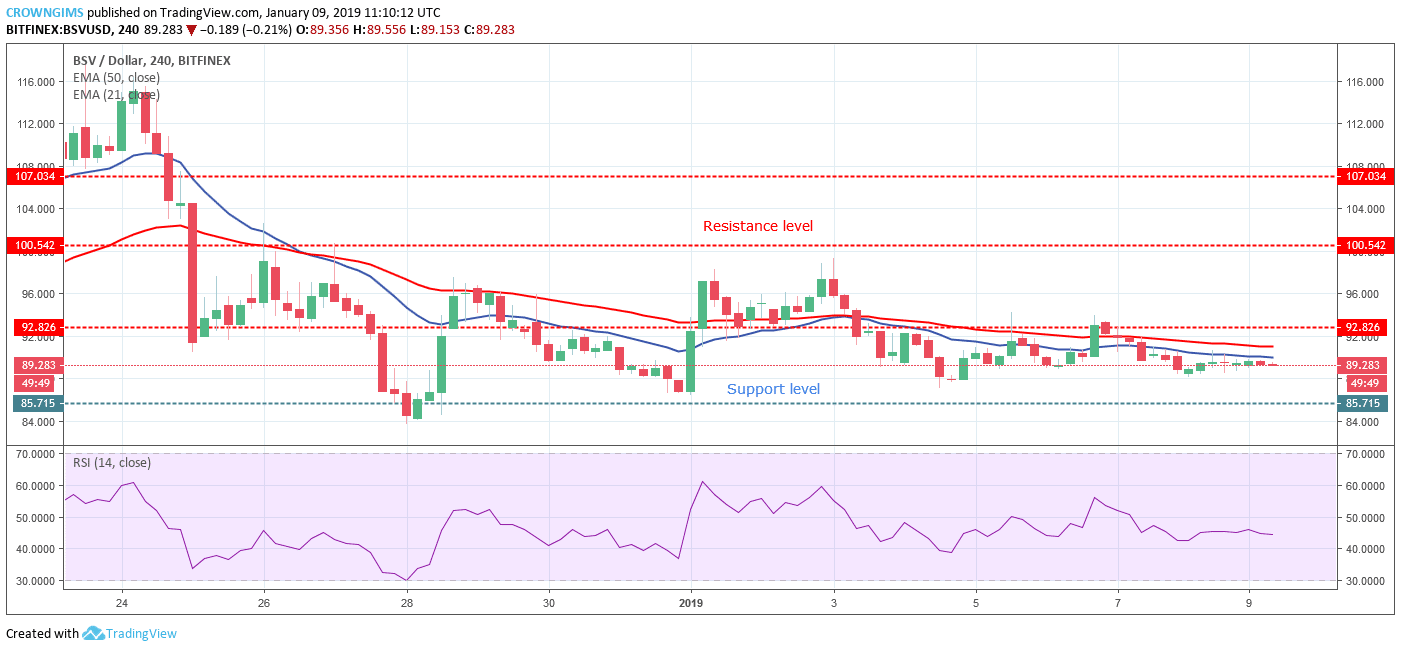
BSV/USD Price Medium-term Trend: Bearish
Resistance levels: $92, $100, $107
Support levels: $85, $80, $73On the medium –term, BSV/USD is on bearish trend; as predicted last week, $92 price level was broke down and the BSV price was moved down towards the previous low. The Bulls lost the pressure after the Bitcoin SV price retracement on January 2.
It has no momentum to break out the resistance level of $100.The bears took over and pushed the crypto to break down the former support level of $92. BSV price declined towards $85 support level but unable to penetrate the level, the coin commenced the sideways movement within resistance level of $92 and $85 support level.
The Relative Strength Index period 14 is above 50 levels horizontally placed but flat showing no direction indicates consolidation scenario on the 4-Hour chart. Bitcoin SV price is trading below the two EMAs in which the 50-day EMA is above the 21-day EMA which connotes bearish pressure and sell signal. The breakdown of the support level of $85 with the strong bearish candle closed below the level will make the coin to have its target at $80 support level.
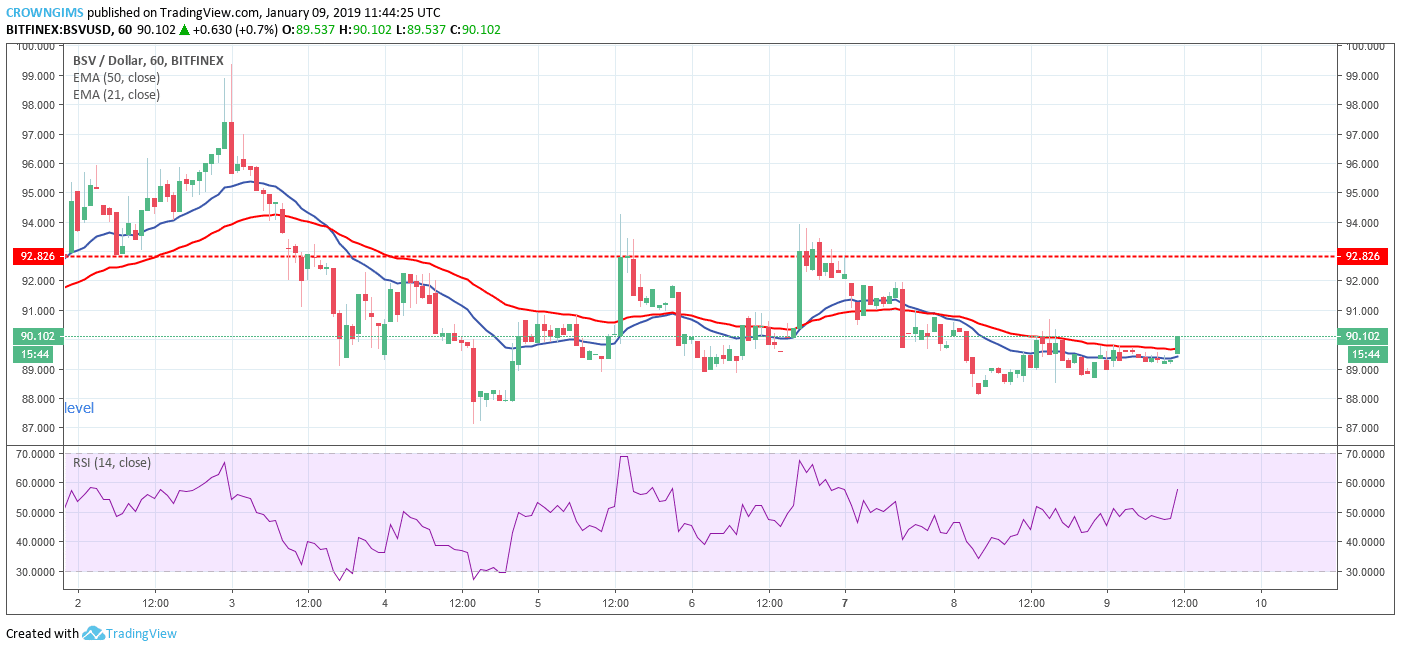
BSV/USD Price Short-term Trend: Bearish
BSV/USD is on the bearish trend on the short-term outlook. The Bitcoin SV price was on the bullish trend last week and the price was topped at $100 resistance level. Strong rejection with the formation of strong bearish engulfing candle returned the coin to the south. The bearish momentum bottomed the coin around $85 demand level since then the coin has been fluctuating within $92 and $85 price range.
Currently, the coin is on the two EMAs with the 21-day EMA and the 50-day EMA closed to each other as a sign of consolidation. However, the Relative strength index is above 50 levels with the signal lines pointing to the north which indicates the buy signal. Should the bulls increase their momentum and were able to penetrate the $92 resistance level, carry out retest successfully, the coin will rally to the previous high of $100 price level.
Azeez Mustapha is a specialist in Computer Studies (including DTP), Forex and Crypto trading professional. Being expert technical and currency analyst, as well as experienced fund manager and author of several books, Azeez places strong focus on crypto market studies conducting comprehensive price analyses and sharing forecasts of presumptive market trends.

 On the medium –term, BSV/USD is on bearish trend; as predicted last week, $92 price level was broke down and the BSV price was moved down towards the previous low. The Bulls lost the pressure after the Bitcoin SV price retracement on January 2.