Cardano (ADA) Price Analysis: Trends of August 31–September 6, 2018
A clear break and weekly close below the demand zone of $0.08 would interrupt the bullish testing supply zone of $0.11 and the demand zone of $0.07 would be exposed.
By Azeez Mustapha
Updated
2 mins readPhoto: Shutterstock
Key Highlights:
Further downward movement is possible next week;
rectangular pattern confirmed;
traders should watch for the break out confirmation.
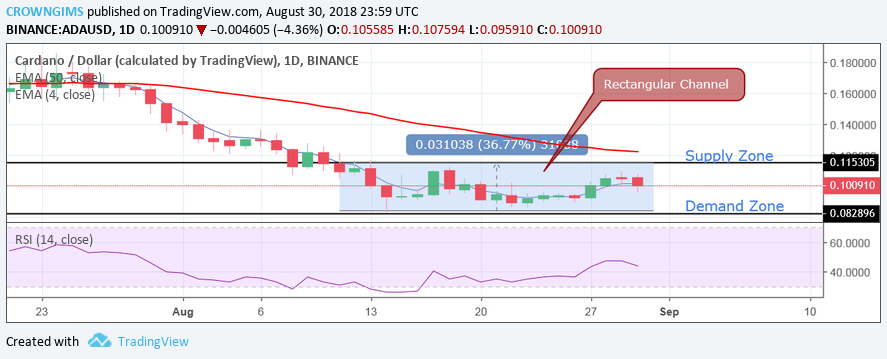
ADA/USD Price Long-term Trend: Bearish
Supply Zones:$0.11, $0.13, $0.17
Demand Zones: $0.08, $0.07, $0.06Cardano was unable to break out of the last week rectangular channel. The coin continued its bearish movement in its long-term. The bearish movement on the daily chart still contained ADA/USD within the rectangular channel, ranging between the supply zone of $0.11 and the demand zone of $0.08.The downward movement was triggered by the bearish pressure that broke the last three weeks strong demand zone.
The EMA 4-day still remains below the 50-day EMA and ADAUSD remains below the 4-day EMA. On the daily chart, more bearish candles are formed, which indicate the possibility of the downtrend continuation. On the downside, a clear break and weekly close below the demand zone of $0.08 would interrupt the bullish testing supply zone of $0.11 and the demand zone of $0.07 would be exposed. The RSI 14 is below the 50-level pointing towards the south. Further downward movement is possible next week.
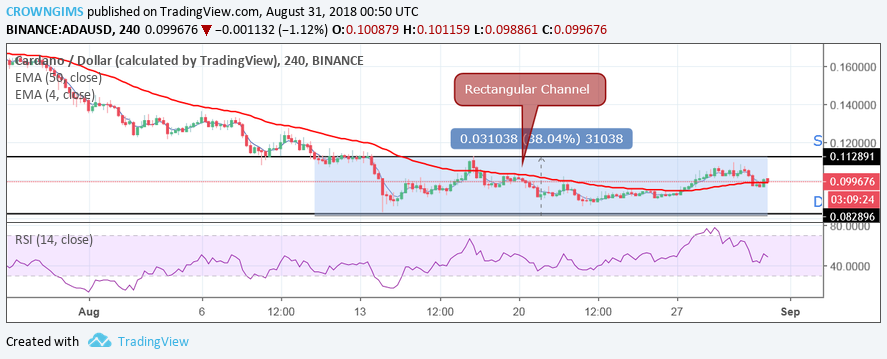
ADA/USD Medium-term Trend: Bearish
Cardano on the 4-H chart last week made an attempt to push higher towards the supply zone of $0.11 but the sellers pushed it back towards the south. The price was above 4-day EMA and crossed over 50-day EMA. At present, the price is returning towards the south with the formation of more bearish candles. The RSI 14 is at the 50 level with the signal line pointing downwards. There is a probability for the coin to retest the demand zone of $0.08 before break out. Uptrend movement could be triggered in case the supply zone of $0.11 is broken.
Traders should watch out for the breakout at the upper supply zone or break down at lower demand zone to occur before taking a position.
Azeez Mustapha is a specialist in Computer Studies (including DTP), Forex and Crypto trading professional. Being expert technical and currency analyst, as well as experienced fund manager and author of several books, Azeez places strong focus on crypto market studies conducting comprehensive price analyses and sharing forecasts of presumptive market trends.

 Cardano on the 4-H chart last week made an attempt to push higher towards the supply zone of $0.11 but the sellers pushed it back towards the south. The price was above 4-day EMA and crossed over 50-day EMA. At present, the price is returning towards the south with the formation of more bearish candles. The RSI 14 is at the 50 level with the signal line pointing downwards. There is a probability for the coin to retest the demand zone of $0.08 before break out. Uptrend movement could be triggered in case the supply zone of $0.11 is broken.