Cardano (ADA) Price Analysis: Trends of September 7–13, 2018
Uptrend movement could be triggered in case the supply zone of $0.11 is broken; a clear break and weekly close above the supply zone of $0.11 would interrupt the bearish testing demand zone of $0.08 and the supply zone of $0.13 would be exposed.
traders are advised to trade along with the trend.
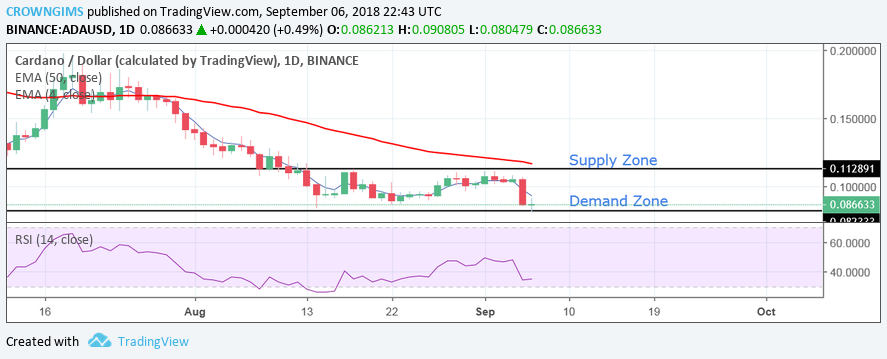
ADA/USD Price Long-term Trend: Bearish
Supply Zones: $0.11, $0.13, $0.17
Demand Zones: $0.08, $0.07, $0.06The price headed towards lower trend line at $0.08 with the emerging of a massive bearish candle on the daily chart. It had a strong rejection at the level. Cardano still contained within the channel, ranging between the supply zone of $0.11 and the demand zone of $0.08. It was unable to break out of the channel last week. The coin continued its bearish movement in its long-term.
The EMA 4-day still remains below the 50-day EMA and ADA/USD remains below the 4-day EMA. On the daily chart, more bearish candles are formed, which indicate the possibility of the downside breakout at the demand zone of $0.08. On the upside, a clear break and weekly close above the supply zone of $0.11 would interrupt the bearish testing demand zone of $0.08 and the supply zone of $0.13 would be exposed. The RSI 14 is at the oversold below 25-level pointing towards the north. There may be upward movement next week should the demand zone of $0.08 holds.
ADA/USD Medium-term Trend: Bearish
Cardano on the 4-H chart last week made an attempt to push higher towards the supply zone of $0.11 but interrupted by the formation of massive bearish candles. The price reduces towards demand zone of $0.08. It had a rejection which ended up with the formation of the bullish candles.
The price was below 4-day EMA and crossed 50-day EMA downside. At present, the price is returning towards the north with the formation of more bullish candles. The RSI 14 is below 20 level with the signal line pointing upwards. There is a probability for the coin to retest the demand zone of $0.08 before break out. Uptrend movement could be triggered in case the supply zone of $0.11 is broken. Traders are advised to take position along with the trend.
Azeez Mustapha is a specialist in Computer Studies (including DTP), Forex and Crypto trading professional. Being expert technical and currency analyst, as well as experienced fund manager and author of several books, Azeez places strong focus on crypto market studies conducting comprehensive price analyses and sharing forecasts of presumptive market trends.

 The price headed towards lower trend line at $0.08 with the emerging of a massive bearish candle on the daily chart. It had a strong rejection at the level.
 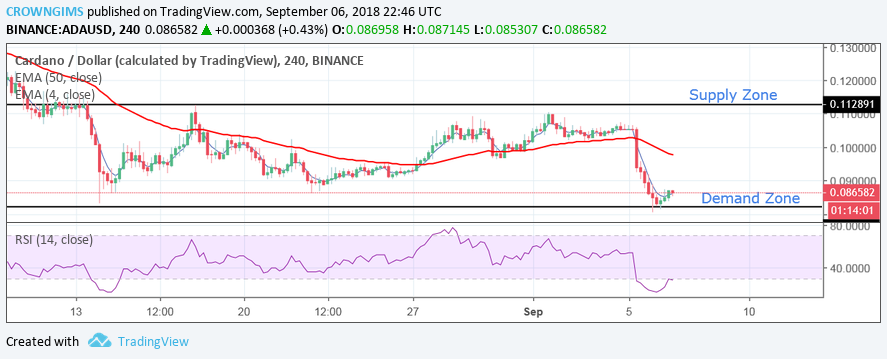 Cardano on the 4-H chart last week made an attempt to push higher towards the supply zone of $0.11 but interrupted by the formation of massive bearish candles. The price reduces towards demand zone of $0.08. It had a rejection which ended up with the formation of the bullish candles.