Cardano Price Analysis: ADA/USD Trends of October 26–November 1, 2018
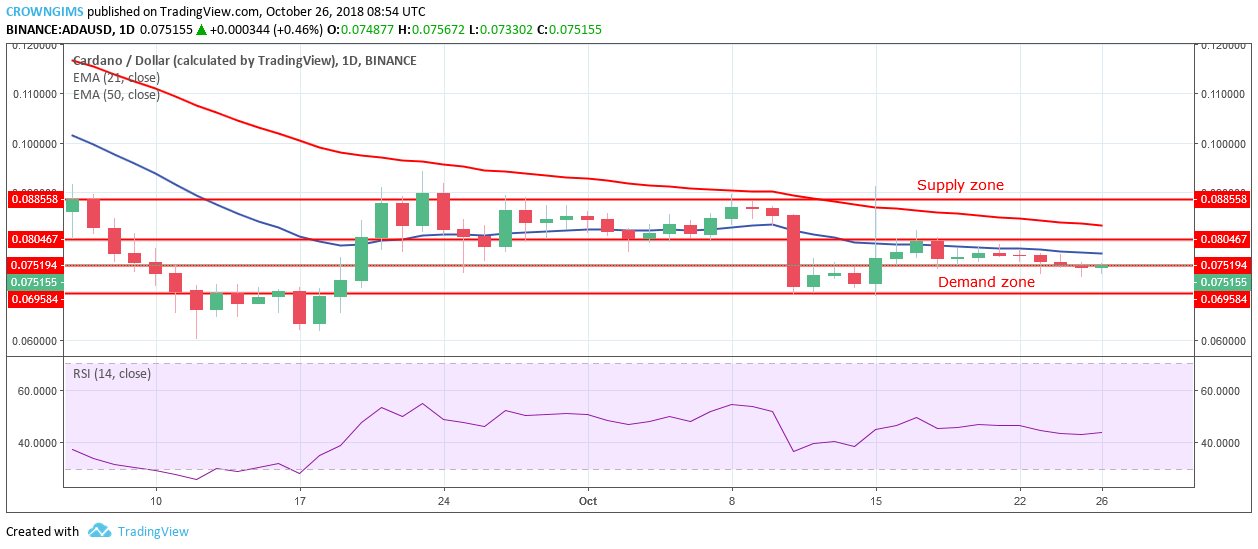
Should Cardano price fall to the demand zone of $0.069, and the bulls defend this zone, ADA price will bounce to the north towards the supply zone of $0.080. ADA will resume its uptrend movement towards the supply zone of $0.088.
By Azeez Mustapha
Updated
2 mins readPhoto: Shutterstock
traders should look out for buy stops to initiate long trades.
ADA/USD Price Long-term Trend: Bearish
Supply Zones: $0.080, $0.088, $0.094
Demand Zones: $0.075, $0.069, $0.062ADA continues in its bearish movement on the long-term outlook. ADA price started falling after the sudden increase that occurred on the October 15; the bulls enter the market with high momentum and pushed the pair to the north with the formation of massive bullish candle that broke the supply zones of $0.080 and $0.088 and exposed the supply zone of $0.094.
The continuation of uptrend movement was rejected by the bears’ strong momentum and the price was pushed to the demand zone of $0.075. ADA price started falling gradually and now it has broken down the demand zone of $0.075. It is now exposed to the demand zone of 0.069.
Should Cardano price fall to the demand zone of $0.069, and the bulls defend this zone, ADA price will bounce to the north towards the supply zone of $0.080. Traders may setup buy stops to initiate long trades.
The price is below 21-day EMA and the 50-day EMA which indicates that the price is falling.RSI is above 40-level pointing towards the south indicates that there are possibilities for further downward movement.
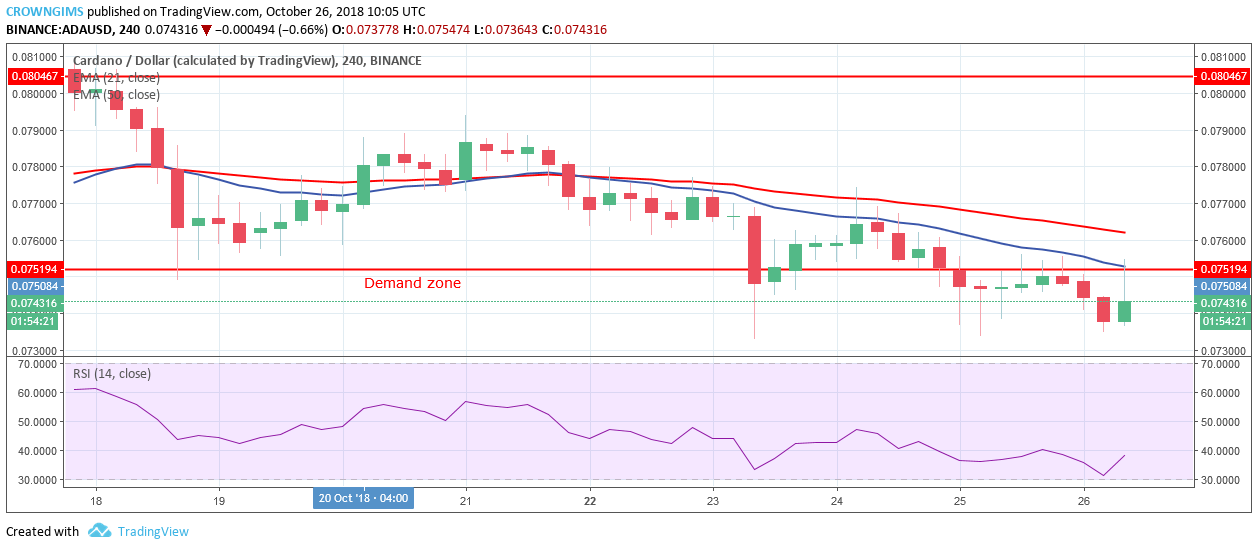
ADA/USD Price Medium-term Trend: Bearish
On the 4-H chart, ADA is in its bearish trend. Ada price started falling on October 21, on the medium-term. It is clearly seen on the chart that 21-day EMA crosses 50-day around that period. It has been falling gradually, broke the demand zone of $0.075. In case the bears increase their pressure and sustain it, the coin will find its low at the demand zone of $0.062.
In case the demand zone of $0.075 holds, the price will bounce to the north and break the strong supply zone of $0.080, ADA will resume its uptrend movement towards the supply zone of $0.088.
21-day EMA has crossed the 50-day EMA downside and the price is below 21-day EMA and 50-day EMA, the two EMAs are the distance from each other which indicates downtrend is ongoing.
Nonetheless, the RSI period 14 is on 30levels with signal lines point to the north, which indicates buy signal which may be a pullback.
Azeez Mustapha is a specialist in Computer Studies (including DTP), Forex and Crypto trading professional. Being expert technical and currency analyst, as well as experienced fund manager and author of several books, Azeez places strong focus on crypto market studies conducting comprehensive price analyses and sharing forecasts of presumptive market trends.

 ADA continues in its bearish movement on the long-term outlook. ADA price started falling after the sudden increase that occurred on the October 15; the bulls enter the market with high momentum and pushed the pair to the north with the formation of massive bullish candle that broke the supply zones of $0.080 and $0.088 and exposed the supply zone of $0.094.