As Bitcoin’s dominance remains at 60.86%, Ethereum’s dominance has slipped to 10.36%. Will the constant bullish failures prolong Ether’s downfall, or is this the last opportunity to buy Ethereum under $3,000?
Ethereum Weekly Chart Analysis: Broadening Wedge Eyes a New ATH
On the weekly front, the Titan of Crypto, a popular analyst on X with 198.3K followers, reflects a bullish opportunity for Ethereum. The current weekly candle is forming the third higher low from a critical support trendline, signaling a bullish reversal.
#Ethereum Most Hated Rally Incoming 🚀#ETH continues to print higher lows, reinforcing its bullish trend despite prevailing skepticism. pic.twitter.com/FXzmBYwCIp
Supporting the upside potential, the massive tail formation in the weekly candle reveals strong support at lower levels. The support trendline is part of a broadening wedge pattern, with the upper trendline projecting the first target level of $5,338.
This coincides with the 100% Fibonacci level, hinting at a new all-time high.
Extending the bull run, the 161.80% and 200% Fibonacci levels at $7,321 and $8,546 become the primary and tertiary target levels. The basis of this highly optimistic projection lies in the continuous high-low formation on the weekly chart, ongoing since late 2022.
Historical Ethereum Trends: A Pattern of 90-100% Surges
Adding bullish hope for Ethereum traders, crypto analyst Ted Pillows presents another bullish scenario for ETH. Over the past year, the ETH price trend has formed three long-tailed weekly candles, marking a bottom near the $2,000 psychological level.
Ethereum had one capitulation candle in Q1 2024, Q3 2024 and Q1 2025.
Last two times, it resulted in a bottom, and $ETH pumped 90%-100% in the next 8-12 weeks.
This time, I think something similar will happen again. Ethereum will melt faces 🔥 pic.twitter.com/qKnZen8Gcz
These occurrences happened in Q1 2024, Q3 2024, and Q1 2025.
Historically, Ethereum pumped nearly 90-100% over 8-12 weeks after forming such patterns. If this historical price trend continues, Ethereum is likely to break past the $4,000 psychological resistance.
Based on Ted Pillows’ analysis, the breakout rally could extend to $8,000.
Ethereum Analysis: Triangle Pattern Resembling 2021 Bull Run
Taking a closer look at the daily timeframe, crypto analyst Crypto Rover shares an interesting observation. Highlighting a triangle pattern, Rover draws parallels with Ethereum’s historical price action.
In 2020 and 2021, Ethereum faked a breakout from a broken front line, only to retest the support level of a triangle pattern. Following the retest, Ethereum exploded into the 2021 bull rally.
The 2024-25 price trend seems to mirror this pattern, suggesting a potential breakout rally. With recent lower price rejections signaling a bullish comeback, Ethereum could be on the verge of repeating the 2021 bull run.
Institutional Accumulation: BlackRock Leads the Charge
Amid highly optimistic price action, institutions continue to buy Ethereum aggressively, fueling speculation about a massive rally. In a recent X post, Michael van de Poppe highlighted that institutions have purchased over $500 million worth of Ethereum through ETFs.
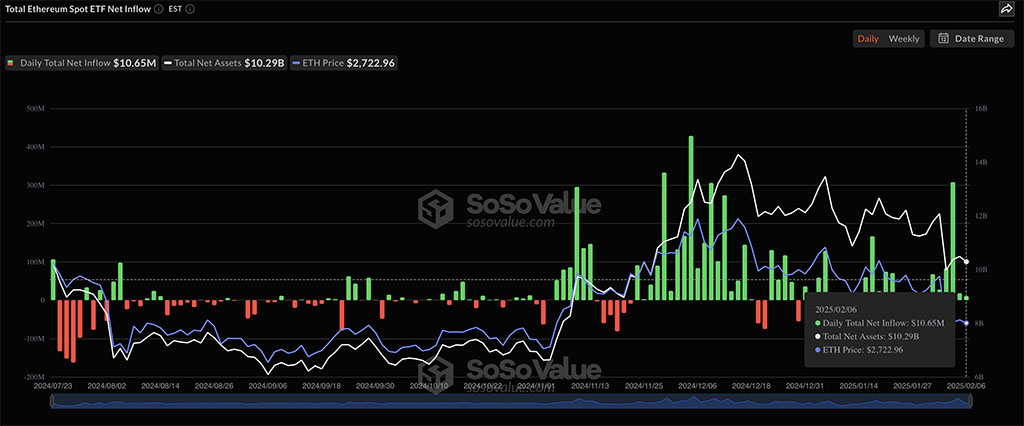
On February 6th, the daily total net inflow for US Ethereum spot ETFs stood at $10.65 million. While eight ETFs remained on the sidelines, BlackRock was the only ETF with an inflow of $10.65 million.
This marks the sixth consecutive positive day for Ethereum ETFs, although it is the lowest inflow over the past week.
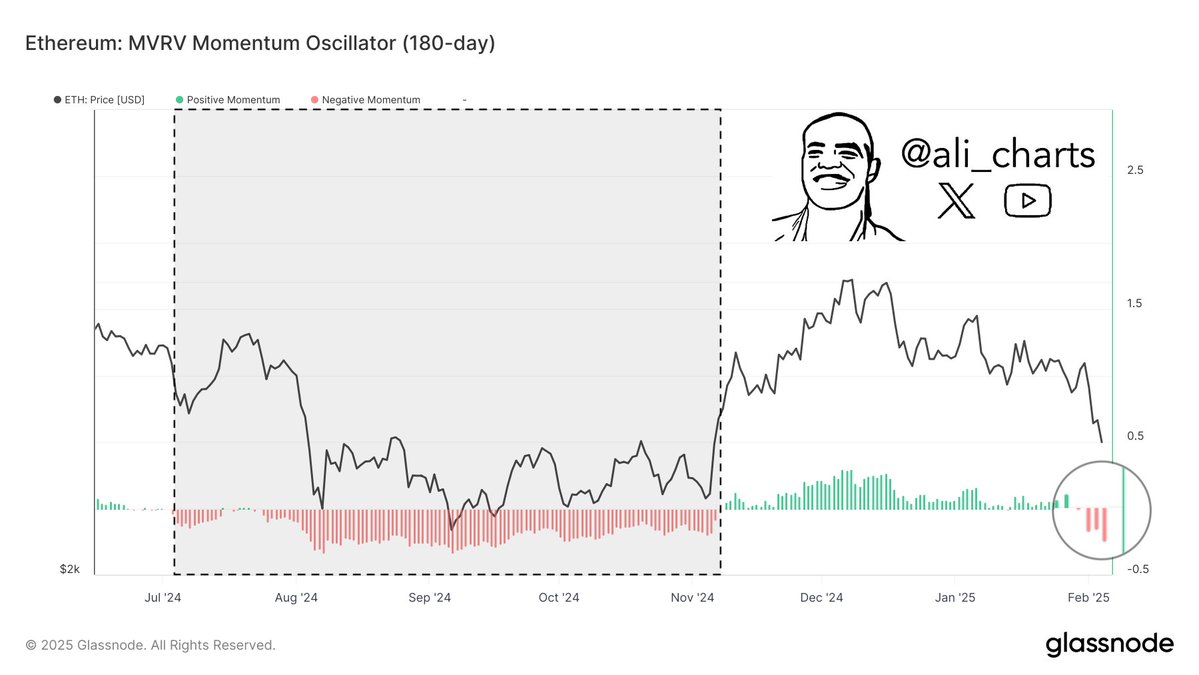
However, the bullish outlook is not without risks. In a recent X post, independent crypto analyst Ali Martinez pointed out a bearish signal in the market-value-to-real-value (MVRV) momentum oscillator.
In February 2025, the MVRV momentum oscillator turned negative — a move that previously led to Ethereum’s slump in August 2024. This indicator suggests short-term downside risks, despite the larger bullish trend.
Conclusion: Ethereum at a Critical Turning Point
Ethereum’s price action presents a crucial opportunity, as analysts highlight strong bullish setups across weekly and daily timeframes. The broadening wedge pattern, historical pump cycles, and triangle formation suggest that ETH is on the verge of a breakout, with targets ranging from $4,000 to $8,546.
Institutional accumulation, led by BlackRock’s continued ETF inflows, reinforces the long-term bullish outlook. However, bearish signals from the MVRV momentum oscillator hint at potential short-term risks.
Ultimately, Ethereum’s ability to hold above $2,700 will determine if this is the last chance to buy under $3,000 or if further correction awaits before the next leg up.
Disclaimer: Coinspeaker is committed to providing unbiased and transparent reporting. This article aims to deliver accurate and timely information but should not be taken as financial or investment advice. Since market conditions can change rapidly, we encourage you to verify information on your own and consult with a professional before making any decisions based on this content.
Vishal, a Bachelor of Science graduate, began his journey in the crypto space during the 2021 bull run and has since navigated the subsequent market winter. With a strong technical background, he is dedicated to delivering insightful articles rich in technical details, empowering readers to make well-informed decisions.