ETH jumped 17% in 24 hours, breaking past the $2,000 level.
Trading volume soared 108% to $38.4B, signaling fresh market enthusiasm.
A whale opened a $17.5M leveraged long on ETH via Hyperliquid, fueling bullish momentum.
Ethereum ETH$2 13924h volatility:4.1%Market cap:$258.40 BVol. 24h:$28.11 B
has finally snapped out of its months-long consolidation, posting a massive 17% surge in the past 24 hours to trade at $2,249. The move comes as a surprise to many in the community who had been criticizing ETH’s stagnation below $2,000 since early March.
The rally has also triggered a 108% spike in trading volume, now totaling $38.4 billion — a sign of renewed investor interest.
Popular crypto analyst Ali Martinez pointed out on X that Ethereum is again testing the $2,100-$2,300 range — a critical zone that has acted as both support and resistance for the token.
This is the fifth time ETH has hit this level in the past year. “Clearing $2,380 could ignite a new bull rally,” Martinez wrote. Crypto trader Mister Crypto also echoed bullish sentiment, stating it’s “time for a massive rally.”
Adding weight to that narrative, data from LookonChain revealed that a crypto whale opened a massive long position on ETH. The investor transferred 8.58 million USDC into Hyperliquid with 2x leverage and later added another 8.88 million USDC.
The position now stands at 17,702 ETH worth $36.3 million, a clear signal of growing confidence among big investors.
Eth price outlook
The current Ether price zone mirrors levels seen in November 2023, which eventually led a rally to over $4,000. If history repeats, the second-largest cryptocurrency might be setting up for another explosive move.
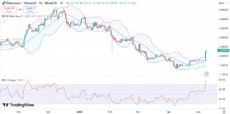
On the daily chart, ETH has seen a sharp breakout above the upper Bollinger Band, indicating strong upward momentum. If the price drops to the mid band (20-day SMA), traders could see a short-term consolidation. Key support lies at the lower band around $1,825.
ETH price chart with RSI and Bollinger bands | Source: TradingView
The RSI stands at 79, firmly in overbought territory. While this could indicate a potential pullback, sustained RSI levels often accompany strong bull phases.
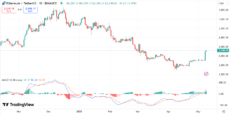
Meanwhile, the MACD has confirmed a bullish crossover, with the MACD line moving sharply above the signal line.
ETH price chart with MACD | Source: TradingView
The bull case is also supported by increasing histogram bars. If ETH breaks above the critical resistance at $2,380, it could trigger a rally toward $2,600 and beyond.
Disclaimer: Coinspeaker is committed to providing unbiased and transparent reporting. This article aims to deliver accurate and timely information but should not be taken as financial or investment advice. Since market conditions can change rapidly, we encourage you to verify information on your own and consult with a professional before making any decisions based on this content.
A crypto journalist with over 5 years of experience in the industry, Parth has worked with major media outlets in the crypto and finance world, gathering experience and expertise in the space after surviving bear and bull markets over the years. Parth is also an author of 4 self-published books.