Ethereum Price Analysis: ETH/USD May Break Out at $159 After a Short Retracement
In case the Bears increase their momentum there would be another break out at the $159 price level and then Ethereum will have its support at $150 demand level. In case the bulls defend $159 price level, $168 may be the price target.
By Azeez Mustapha
Updated
2 mins readPhoto: QuoteInspector
Key Highlights:
There could be a break out at $159 price level in Ethereum market;
the Bears are in control of the ETH market;
the price correction is ongoing in the ETH market.
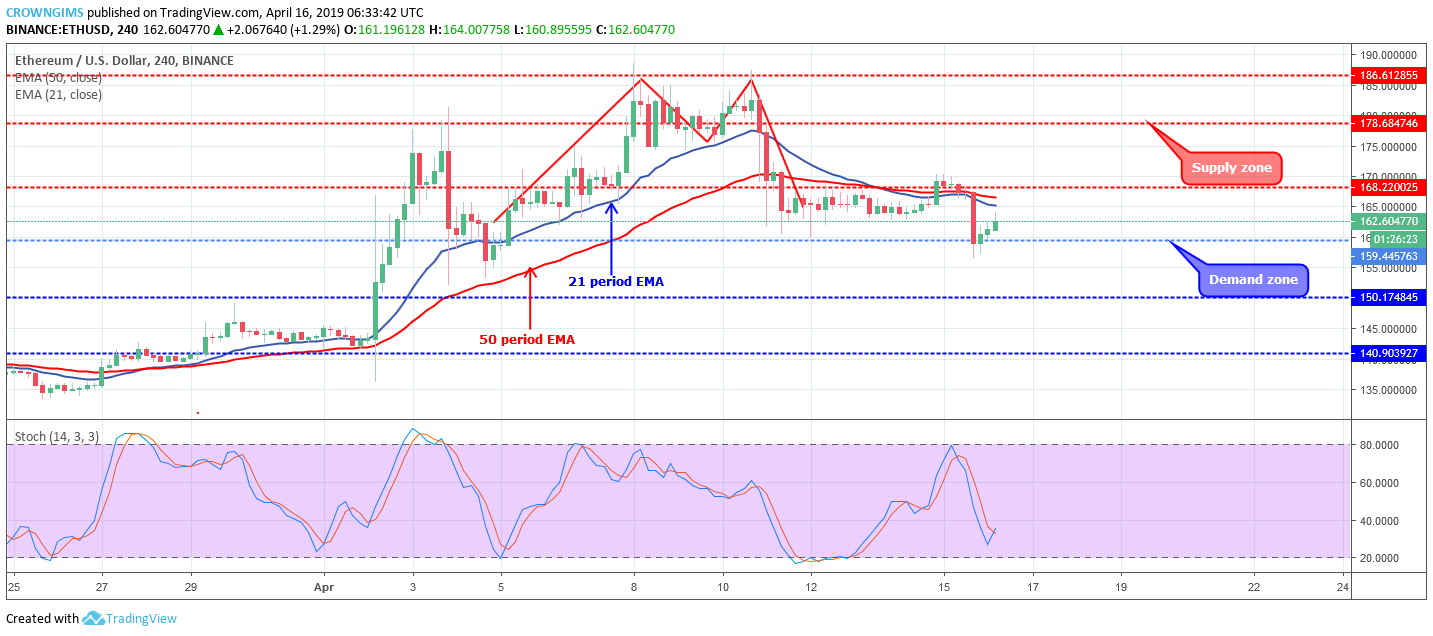
ETH/USD Medium-term Trend: Bearish
Supply Zones: $168, $178, $186
Demand Zones: $159, $150, $140ETH continues on the bearish trend on the medium-term outlook. After the completion of double top formation and the coins has been bearish on the H4 chart. Selling pressure was strong and Ethereum price has been heading towards the south and reached the demand zone of $159.
There was a price rejection by the Bulls and the Bulls’ pressure was not enough to break up the supply zone of $168, then sideways movement began on April 11 till April 15. Yesterday, second to the last 4-Hour candle ended up being a very good looking bearish candle that placed the price at $159 price level.
Today’s first 4-hour candle came out as a bullish which may serve as Ethereum price correction. At the moment, the price is at the level where the price reacted heavily earlier. This means it has a level of potential resistance where the sellers could take advantage.
In case the Bears increase their momentum there would be another break out at the $159 price level and then ETH will have its support at $150 demand level. In case the bulls defend $159 price level, $168 may be the ETH target.
ETH/USD Short-term Trend: Bearish
Ethereum price is on the bearish trend on the short-term outlook. The price is under bearish pressure and it fell to the low at $168. The bears broke down the mentioned level but could not push down further to $159 but commenced consolidation.
The 21 periods EMA has crossed the 50 periods EMA downside and the coin is trading below the two EMA as a confirmation of the bearish trend. The Stochastic Oscillator period 14 is at 50 levels with the signal lines facing north to indicate a buy signal.
Azeez Mustapha is a specialist in Computer Studies (including DTP), Forex and Crypto trading professional. Being expert technical and currency analyst, as well as experienced fund manager and author of several books, Azeez places strong focus on crypto market studies conducting comprehensive price analyses and sharing forecasts of presumptive market trends.

 ETH continues on the bearish trend on the medium-term outlook. After the completion of double top formation and the coins has been bearish on the H4 chart. Selling pressure was strong and Ethereum price has been heading towards the south and reached the demand zone of $159.
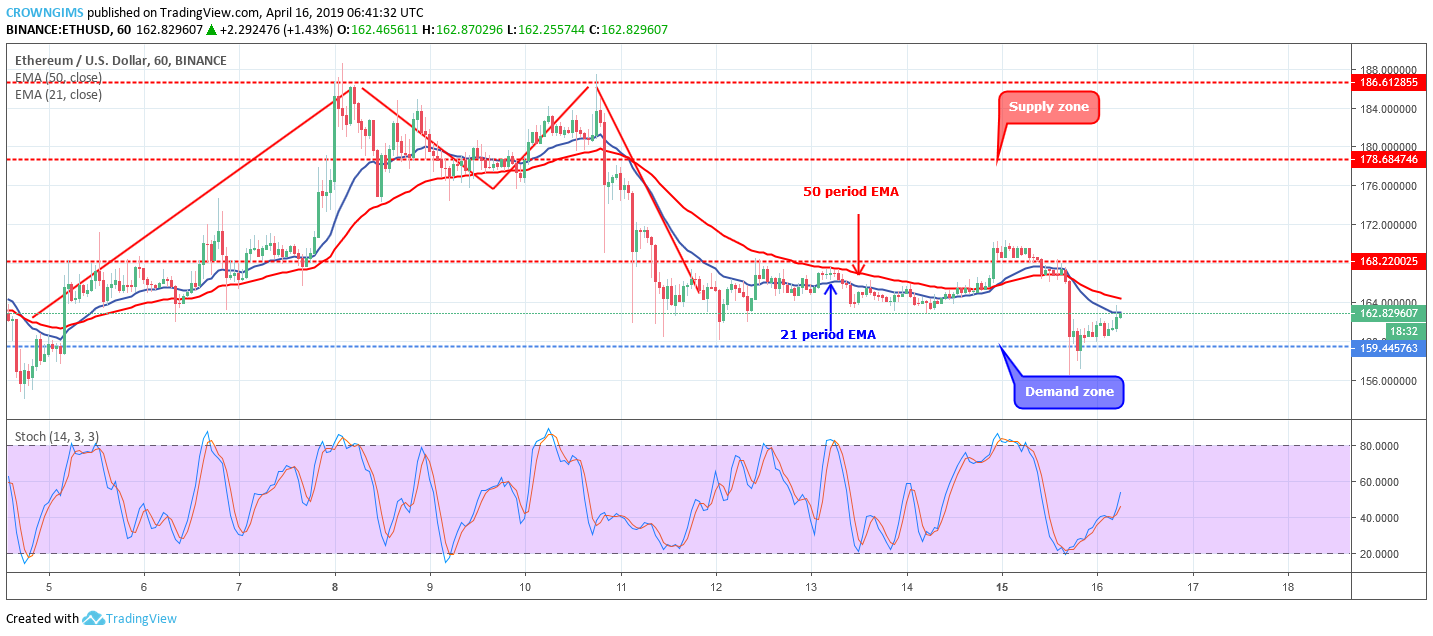 Ethereum price is on the bearish trend on the short-term outlook. The price is under bearish pressure and it fell to the low at $168. The bears broke down the mentioned level but could not push down further to $159 but commenced consolidation.


