Ethereum Price Analysis: ETH/USD Ranging Within $159 and $167, Awaiting a Breakout
Ethereum price may find its support at a previous low of $150 In case the Bears increase their pressure and $159 price level is penetrated. ETH price may increase towards $178 price level in case $167 price level is broken up by the Bulls.
By Azeez Mustapha
Updated
2 mins readPhoto: www.alpari.org
Key Highlights:
The Bears and the Bulls momentum are at equilibrium;
Ethereum price may reach $150 level in case $159 levels do not hold;
the price may penetrate the $167 price level.
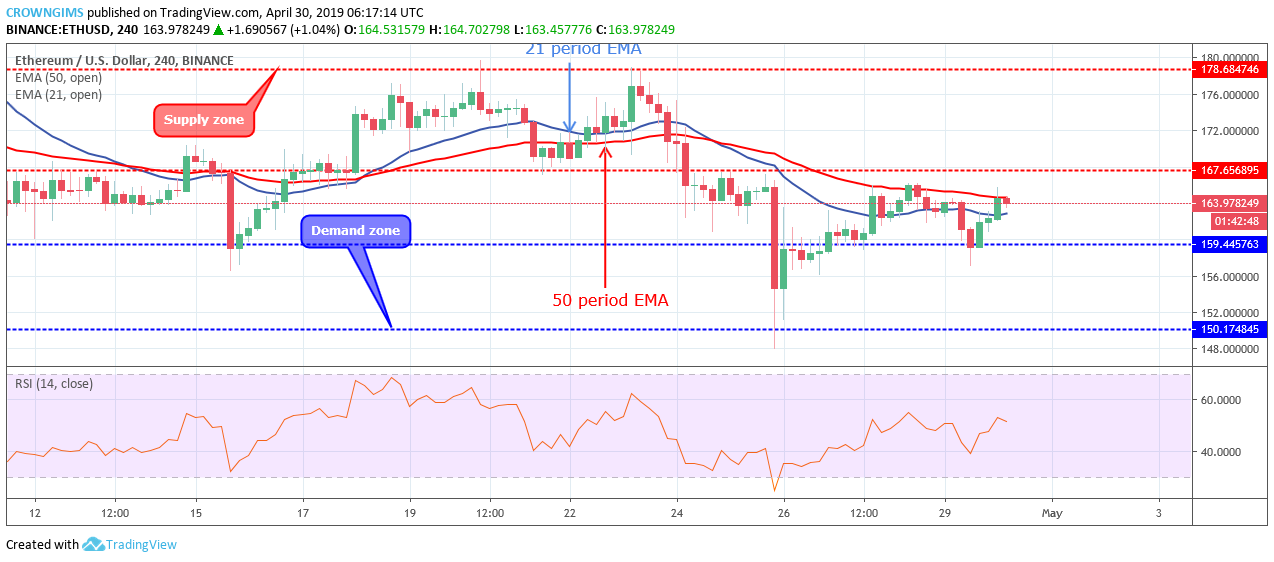
ETH/USD Medium-term Trend: Bearish
Supply Zones: $167, $178, $186,
Demand Zones: $159, $150, $140Ethereum remains bearish on the medium-term outlook. The Bearish momentum continues on the 4- hour chart, Ethereum price declined to the low of $150 price level. The Bulls opposed the decrease in price and the strong bullish candle formed which returned the price back to $159 level.
Ethereum price consolidated for sixteen hours before the Bulls were able to break up the $150 level. The price then started moving sideways between the supply level of $167 and the demand level of $159.
The two EMAs are moving closer to each other without significant direction and ETH price is hovering over the 21 periods EMA and the 50 periods EMA. The Relative Strength Index period 14 is at 50 levels and the signal line bending down to indicate sell signal.
Ethereum price may find its support at a previous low of $150 In case the Bears increase their pressure and $159 price level is penetrated. Coin’s price may increase towards $178 price level in case $167 price level is broken up by the Bulls.
ETH/USD Short-term Trend: Ranging
On the short-term outlook, Ethereum price is on the sideways movement. It dropped to the demand level of $150 with the strong massive bearish candle that emerged on April 25. A Doji candle formed followed by a pin bar.
A pin bar is a bullish reversal candle that made it possible for the Bulls to push up the Ethereum price to break up the $159 level and commence consolidation within the range of $167 and $159 price level.
Ethereum price is trading over the 21 periods EMA and 50 periods EMA as a sign of consolidation. Nevertheless, the Relative strength index period 14 is at 60 levels with the signal line pointing up to indicate a buy signal.
Azeez Mustapha is a specialist in Computer Studies (including DTP), Forex and Crypto trading professional. Being expert technical and currency analyst, as well as experienced fund manager and author of several books, Azeez places strong focus on crypto market studies conducting comprehensive price analyses and sharing forecasts of presumptive market trends.

 Ethereum remains bearish on the medium-term outlook. The Bearish momentum continues on the 4- hour chart, Ethereum price declined to the low of $150 price level. The Bulls opposed the decrease in price and the strong bullish candle formed which returned the price back to $159 level.
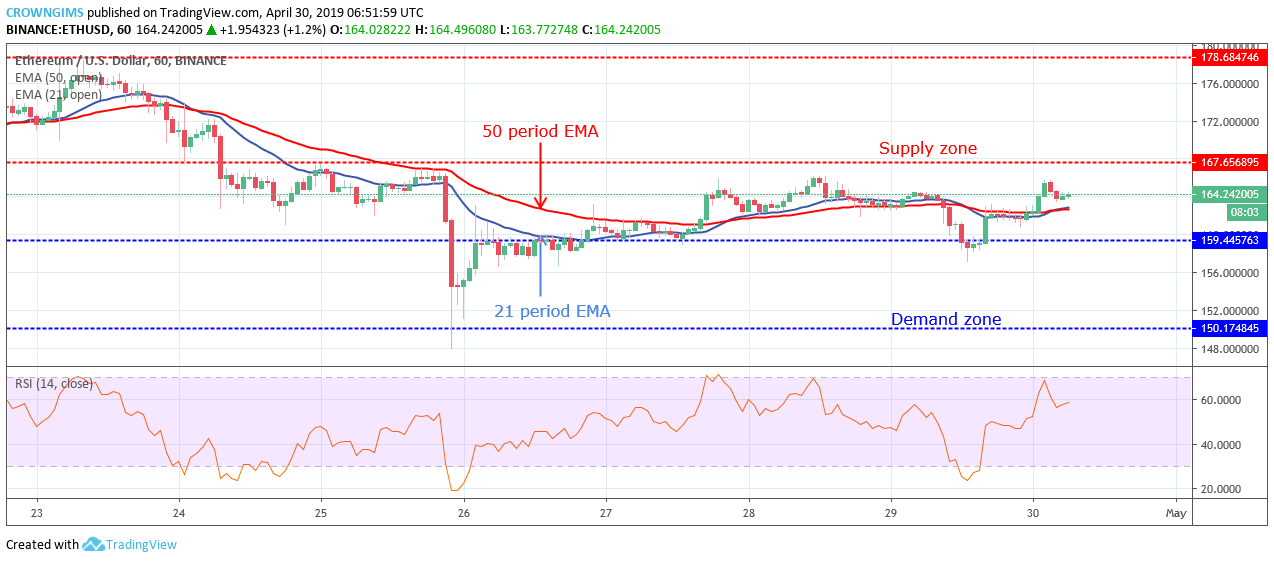 On the short-term outlook, Ethereum price is on the sideways movement. It dropped to the demand level of $150 with the strong massive bearish candle that emerged on April 25. A Doji candle formed followed by a pin bar.


