Ethereum Price Analysis: ETH/USD Remains Near $167, Forming Downtrend
In case the Bears maintain or increase their pressure and $159 level does not hold, Ethereum price may decline to $150 level. Should $159 level hold, the price may bounce and the Bulls may take over.
By Azeez Mustapha
Updated
2 mins readPhoto: QuoteInspector
Key Highlights:
The Bears are still in control of the Ethereum market;
further reduction in Ethereum price continue;
the price may reverse at $159 price level in case the level holds.
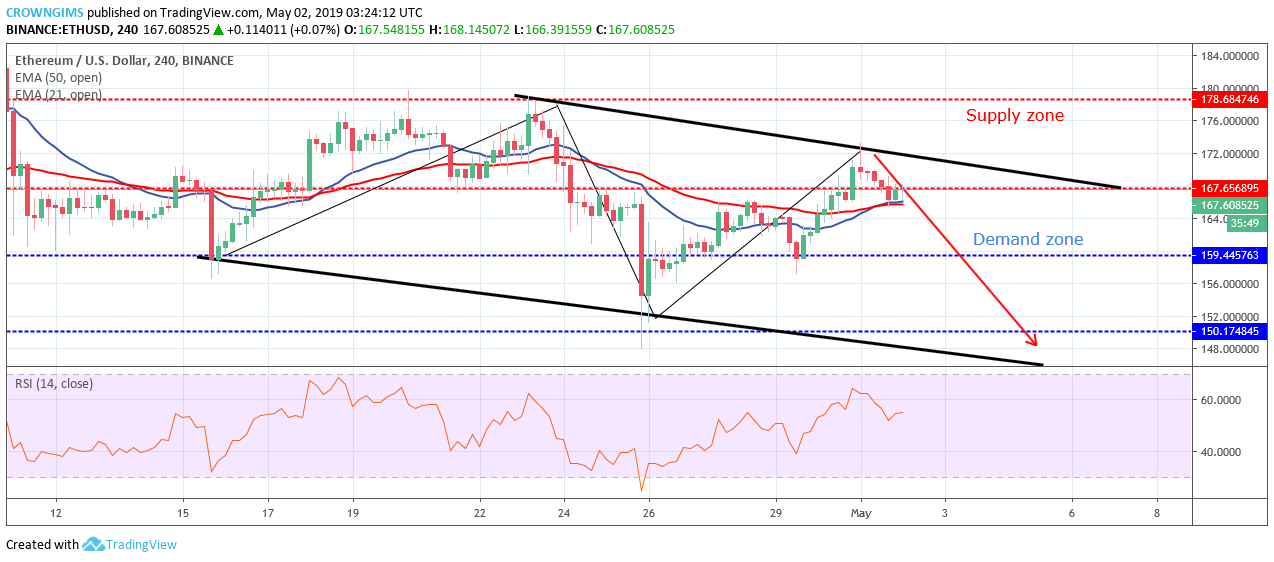
ETH/USD Medium-term Trend: Bearish
Supply Zones: $167, $178, $186,
Demand Zones: $159, $150, $140On the medium-term outlook, ETH is on the bearish trend. The demand zone of $159 hold, the Bears lost the pressure and the Ethereum price bounced. The formation of bullish engulfing candle signaled the increase in the Bulls’ momentum; this propelled the Ethereum price towards $167 level and broke up the level to expose the $178 supply zone.
A pin bar formed on May 01 that indicates a bearish reversal of the price; that is exactly what the market is experiencing currently. Ethereum price movement has led to the formation of a descending channel on the 4-hour chart.
The coin is directly on the two EMAs and the 21 periods EMAs is trying to cross 50 periods EMA downside to indicate that bearish momentum is ongoing in the ETH market.
However, the Relative Strength Index period 14 is above 50 levels and the signal lines pointing down to indicate a further reduction in ETH price. Ethereum is currently heading towards $159 price level.
Further increase in the Bears’ momentum will definitely lead to the decrease in Ethereum price that may break down the $159 level to target $150 price level. Should the Bulls defend $159 level, then, Ethereum price will face the north.
ETH/USD Short-term Trend: Bearish
On the short-term outlook, ETH price is Bearish. The formation of the descending channel on the 1-hour chart is a confirmation of the bearish pressure in the Ethereum market.
Ethereum price is bouncing back as it touches the upper and the lower trend line of the channel. The Relative Strength Index period 14 is at 50 levels with the signal line bending up which indicate buy signal which may act as a pullback.
Azeez Mustapha is a specialist in Computer Studies (including DTP), Forex and Crypto trading professional. Being expert technical and currency analyst, as well as experienced fund manager and author of several books, Azeez places strong focus on crypto market studies conducting comprehensive price analyses and sharing forecasts of presumptive market trends.

 On the medium-term outlook, ETH is on the bearish trend. The demand zone of $159 hold, the Bears lost the pressure and the Ethereum price bounced. The formation of bullish engulfing candle signaled the increase in the Bulls’ momentum; this propelled the Ethereum price towards $167 level and broke up the level to expose the $178 supply zone.
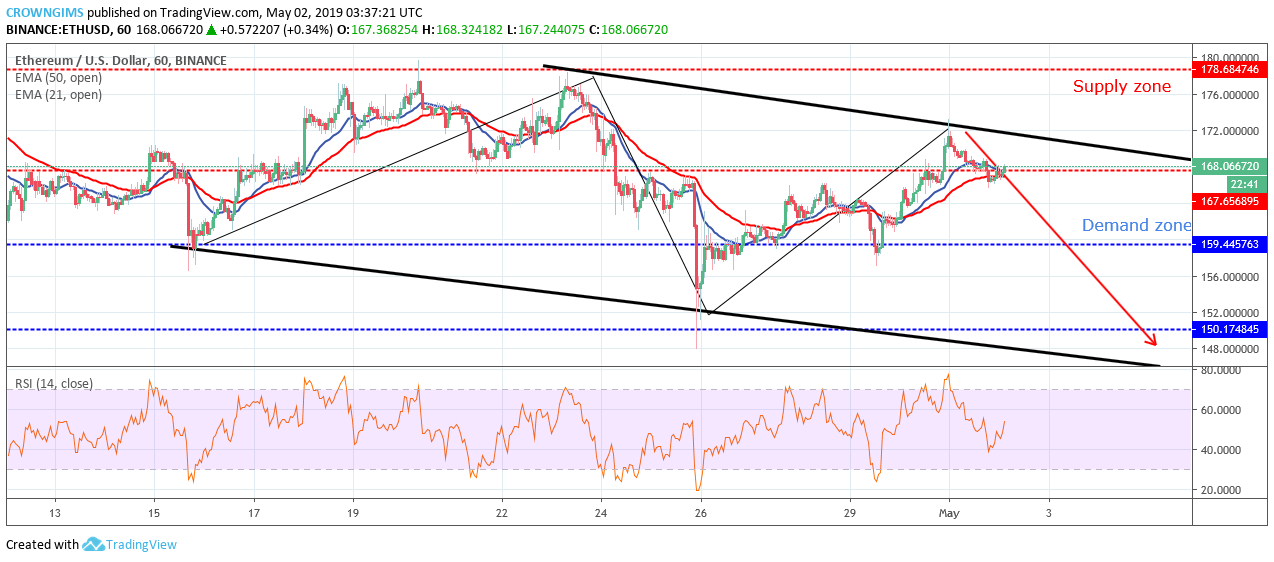 On the short-term outlook, ETH price is Bearish. The formation of the descending channel on the 1-hour chart is a confirmation of the bearish pressure in the Ethereum market.


