Ethereum Price Analysis: ETH/USD Trends of November 13–19, 2018
Should the bulls gain enough momentum and break up the supply level of $227, Ethereum price will rally to the north and may have the supply level of $257 as its target.
By Azeez Mustapha
Updated
2 mins readPhoto: QuoteInspector
there is a probability of the bears taking over the ETH market.
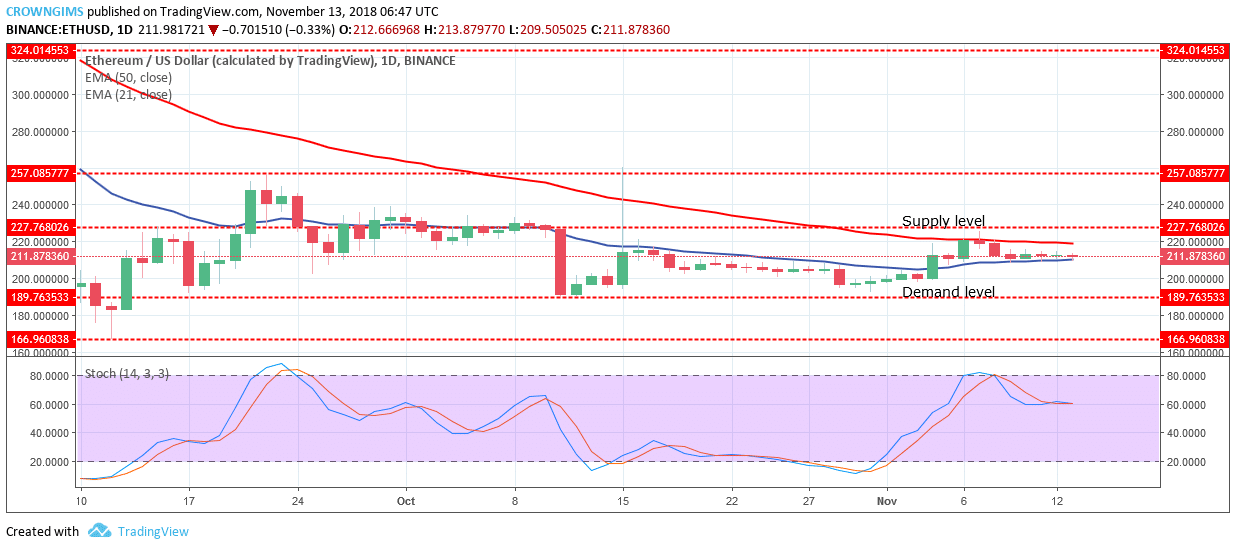
ETH/USD Long-term Trend: Ranging
Supply levels: $227, $257, $324
Demand levels: $189, $166, $147Ethereum is ranging on the long-term outlook. The cryptocurrency has been in a consolidation mode since October 15. ETH price is bound to range between the supply level of $227 and the demand level of $189. The ranging movement started when the bulls gained momentum on October 15 and ETH price was suddenly increased to the high of $257 price level lost the pressure at the point and the bears rejected further increase in ETH price by pushing it below the supply level of $227 and consolidation began.
Neither the bulls nor the bears were able to push the ETH price to rally neither to the North nor to the South respectively. ETH price is currently between the 21-day EMA and 50-day EMA with the two EMAs close to each other; which indicates that consolidation is ongoing.
Should the bulls gain enough momentum and break up the supply level of $227, ETH price will rally to the north and may have the supply level of $257 as its target. On the other hand, in case the bears gain enough pressure and break down the demand level of $189, the coin will find its low at $166 demand level.
Moreover, the Stochastic Oscillator period 14 is at 60 levels with the signal lines interlocked and parallel without direction confirm the ongoing consolidation. Breakout is imminent, It is not logical to take any position on Ethereum market for now until the breakout.
ETH/USD Medium-term Trend: Ranging
ETH/USD is ranging on the 4-Hour chart. The bearish engulfing candle formed on November 9, led the coin into the consolidation phase. The price has been trading within the two dynamic resistance and support (21-day EMA and 50-day EMA) for more than 3 days which connotes consolidation.
Meanwhile, the Stochastic Oscillator period 14 is at 50 levels with the signal lines point to the south which indicates a sell signal.
Azeez Mustapha is a specialist in Computer Studies (including DTP), Forex and Crypto trading professional. Being expert technical and currency analyst, as well as experienced fund manager and author of several books, Azeez places strong focus on crypto market studies conducting comprehensive price analyses and sharing forecasts of presumptive market trends.

 Ethereum is ranging on the long-term outlook. The cryptocurrency has been in a consolidation mode since October 15. ETH price is bound to range between the supply level of $227 and the demand level of $189. The ranging movement started when the bulls gained momentum on October 15 and ETH price was suddenly increased to the high of $257 price level lost the pressure at the point and the bears rejected further increase in ETH price by pushing it below the supply level of $227 and consolidation began.
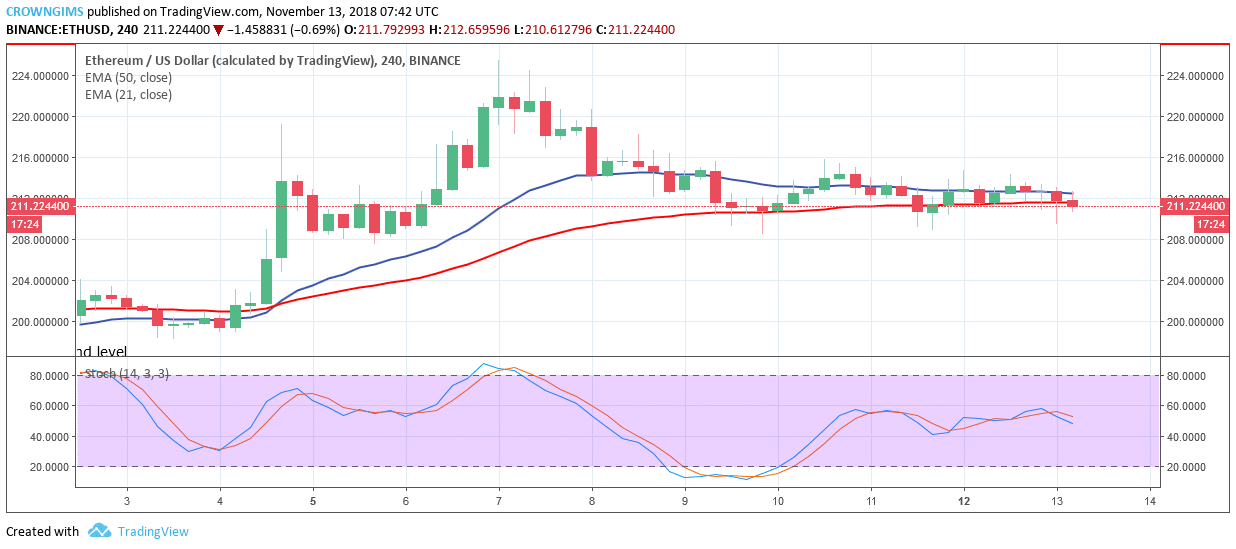 ETH/USD is ranging on the 4-Hour chart. The bearish engulfing candle formed on November 9, led the coin into the consolidation phase. The price has been trading within the two dynamic resistance and support (21-day EMA and 50-day EMA) for more than 3 days which connotes consolidation.