Ali Martinez identifies a potential head-and-shoulders pattern in Optimism's OP chart, hinting at bearish risks.
OP is trading at $1.11 with a 4% 24-hour gain.
Failure to maintain the $1.25 support could lead to further price declines, while a recovery rally may target $2.50 or higher.
Popular crypto analyst Ali Martinez recently noted that Optimism’s OP price chart appears to be forming a classic head-and-shoulders pattern. This often signals a potential bearish reversal, raising concerns about further price corrections.
Currently, OP price OP$0.094624h volatility:0.7%Market cap:$215.79 MVol. 24h:$24.23 M
is trading around $1.11, marking a 4% gain over the past 24 hours. With a market cap of $1.49 billion, OP holds the 60th position in the ranking of top cryptocurrencies by market cap. It has a 24-hour trading volume of over $310 million.
OP Price Trajectory
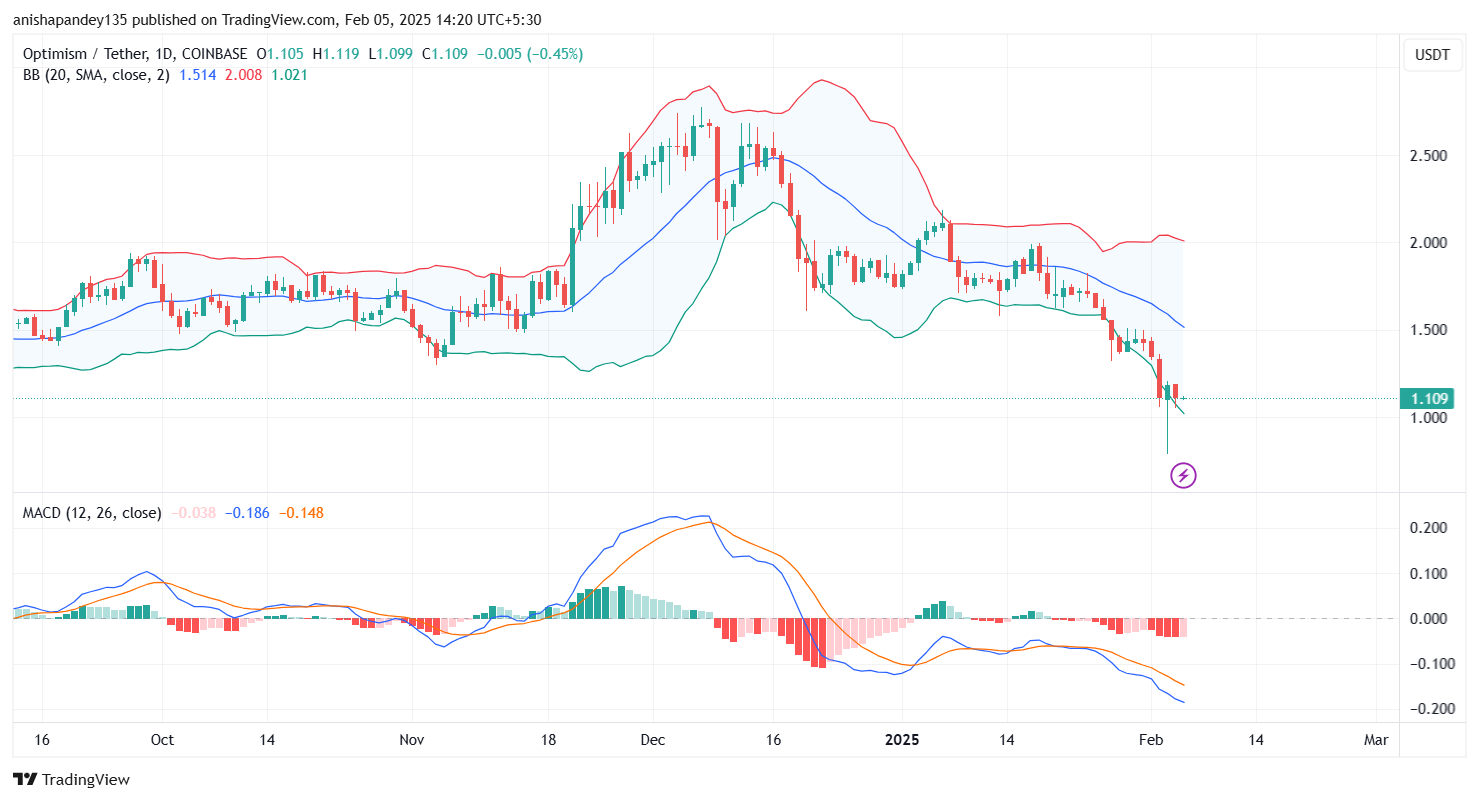
The Moving Average Convergence Divergence (MACD) shows a bearish trend, with the signal line remaining below the MACD line. This setup often reinforces concerns of continued price weakness. Analysts are also noting the presence of a lower-low (LL) wick on the daily chart — a sign of increased downward pressure.
Meanwhile, the Bollinger Bands indicate heightened price volatility. OP is currently testing the lower boundary of these bands, hinting at potential support. However, breaking through this support could result in a deeper downward spiral.
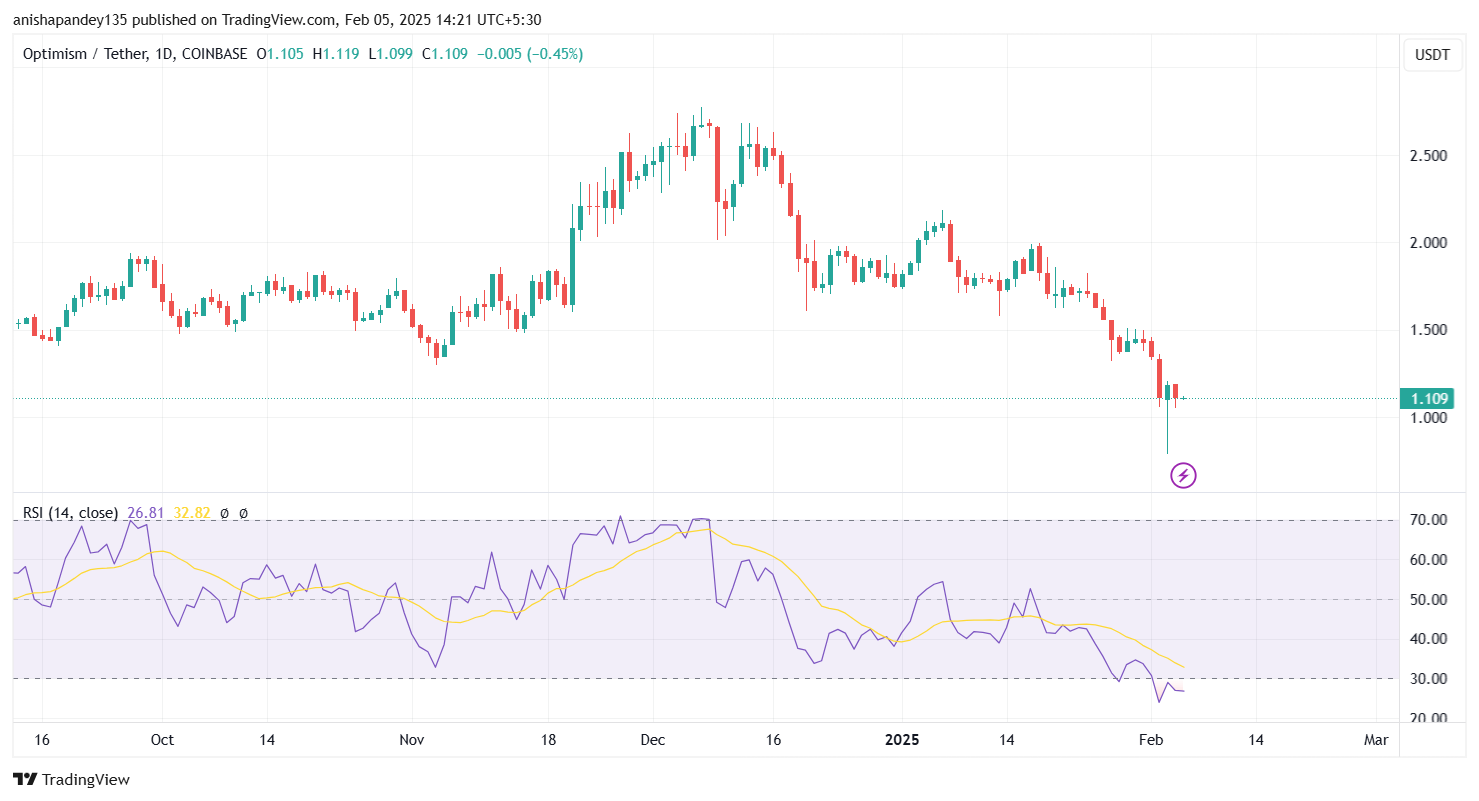
On the other hand, the Relative Strength Index (RSI), hovering near 32.82, suggests that OP is nearing oversold territory. This often signals a possible price rebound, though confirmation from other indicators is necessary.
The token has already tested the 1.618 Fibonacci extension level near $1.02 — a critical point for determining whether a reversal or further decline is imminent. To establish a sustainable uptrend, OP must close above $2.725 on the daily timeframe and form a new peak beyond this level. Such a breakout would signify renewed bullish sentiment and pave the way for further gains.
Can OP Break Out of Its Downward Trend?
Since March 24, OP has been seeing a persistent downward trend, shedding 63% of its value over the past year. Despite this prolonged decline, market analysts remain optimistic about the token’s long-term prospects. Many attribute their confidence to Optimism’s fundamentally strong Layer-2 solutions for the Ethereum network.
If OP manages to hold the $1.25 support and closes above key resistance levels, it could trigger a recovery rally, possibly pushing the token towards $2.50 and beyond.
However, if the token fails to maintain support at $1.25, it would likely result in increased selling pressure, with $1.02 becoming the next critical support level. Breaking below this level could drag the OP price toward even lower lows.
Disclaimer: Coinspeaker is committed to providing unbiased and transparent reporting. This article aims to deliver accurate and timely information but should not be taken as financial or investment advice. Since market conditions can change rapidly, we encourage you to verify information on your own and consult with a professional before making any decisions based on this content.
With a background in finance and a passion for innovation, Anisha has been covering the ever-evolving world of crypto for over four years. Her deep understanding of the crypto market have made her a trusted source for analysis and news. Whether it's dissecting the latest trends or decoding whitepapers, Anisha is dedicated to bringing clarity to the world of digital assets.