Pi Network unveiled Pi App Studio and Ecosystem Directory Staking during its Pi2Day celebrations.
Despite the major rollouts, PI token dropped nearly 4%, showing no bullish reaction.
Technical indicators, such as RSI and MACD, reflect persistent bearish momentum below key Fibonacci levels.
Despite rolling out two new features on its hallmark Pi2Day event, Pi Network (PI) saw its price plummet nearly 4% over the last 24 hours, as investors turned bearish on the digital asset.
On June 28, the project introduced Pi App Studio and Ecosystem Directory Staking—two long-awaited innovations designed to drive app development and boost ecosystem participation. However, the market’s reaction was unexpected.
Happy Pi2Day 2025! @PiCoreTeam unveils $Pi App Studio, an AI-powered no-code platform using blockchain & AI to let anyone build apps—cutting dev time by up to 70% per 2023 studies! Plus, Ecosystem Directory Staking boosts app visibility by staking Pi on Mainnet. With 47M+… pic.twitter.com/vU12ULCNy0
Pi2Day, celebrated annually on June 28 (symbolically 6.28, double the value of Pi at 3.14), marks Pi Network’s evolution as a blockchain project centered on community growth and real-world utility.
The PiCoreTeam announced Pi App Studio, a no-code, AI-powered development tool designed to democratize app creation.
Built with GenAI integration, the platform enables anyone—even those without coding experience—to build decentralized applications simply by describing their vision in plain language.
Pi Network also debuted the Ecosystem Directory Staking initiative. This feature introduces a decentralized ranking system, where users can stake Pi tokens on apps they value, influencing app visibility on the network.
According to Pi Network, both features are now live on the Pi Browser and align with previous additions to the Pi ecosystem, including the Pi Wallet, .pi Domains, and Pi Ad Network.
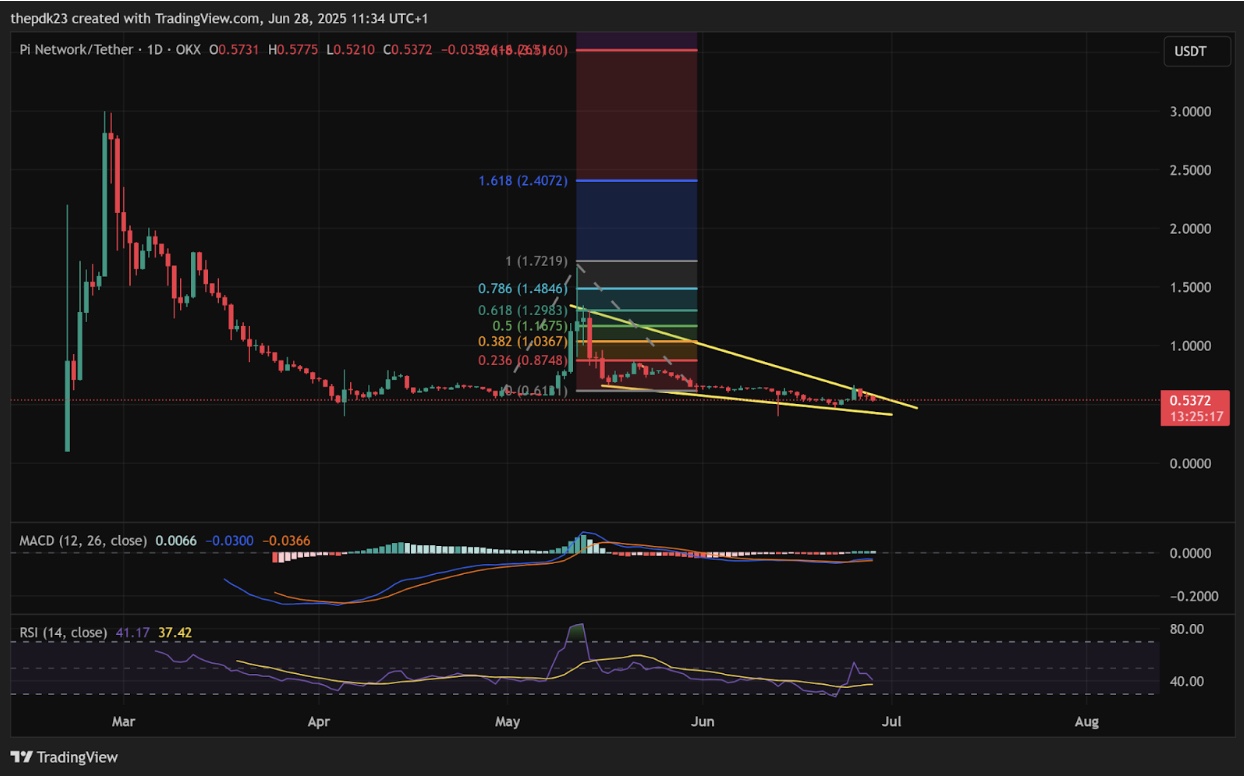
As per the chart below, the MACD indicator on the daily timeframe shows that the blue MACD line is curling beneath the orange signal line, signaling ongoing bearish momentum.
Although the histogram is flattening, it hasn’t confirmed a bullish crossover yet—suggesting the downtrend could continue or at least stall.
Meanwhile, the Relative Strength Index (RSI) hovers near 37.42, dangerously close to the oversold threshold of 30, indicating weak buying interest. Unless RSI picks up to above 45, bullish momentum may stay subdued.
From the high of $2.61 to the local low around $0.61, key Fibonacci retracement levels show that PI stuck below even the 0.236 retracement, signaling a major breakdown. For bulls to regain control, PI needs to reclaim $0.875 first.
PI Daily Chart with RSI and MACD | Source: TradingView
Also, the chart reveals a tightening falling wedge pattern, typically considered bullish in a downtrend. A breakout from this wedge could set the stage for a reversal, but confirmation requires a close above $0.60 followed by reclaiming the $0.8748 (Fib 0.236) resistance level.
Disclaimer: Coinspeaker is committed to providing unbiased and transparent reporting. This article aims to deliver accurate and timely information but should not be taken as financial or investment advice. Since market conditions can change rapidly, we encourage you to verify information on your own and consult with a professional before making any decisions based on this content.
A crypto journalist with over 5 years of experience in the industry, Parth has worked with major media outlets in the crypto and finance world, gathering experience and expertise in the space after surviving bear and bull markets over the years. Parth is also an author of 4 self-published books.